


 本文介绍如何利用SVG技术来绘制柱状统计图。首先计算每个柱子的宽度,然后通过for循环逐个绘制柱子,并在图表上显示数据和部门信息。最终展示了一张完整的柱状统计图。
svg画统计图
首先以 下图先分析一下:
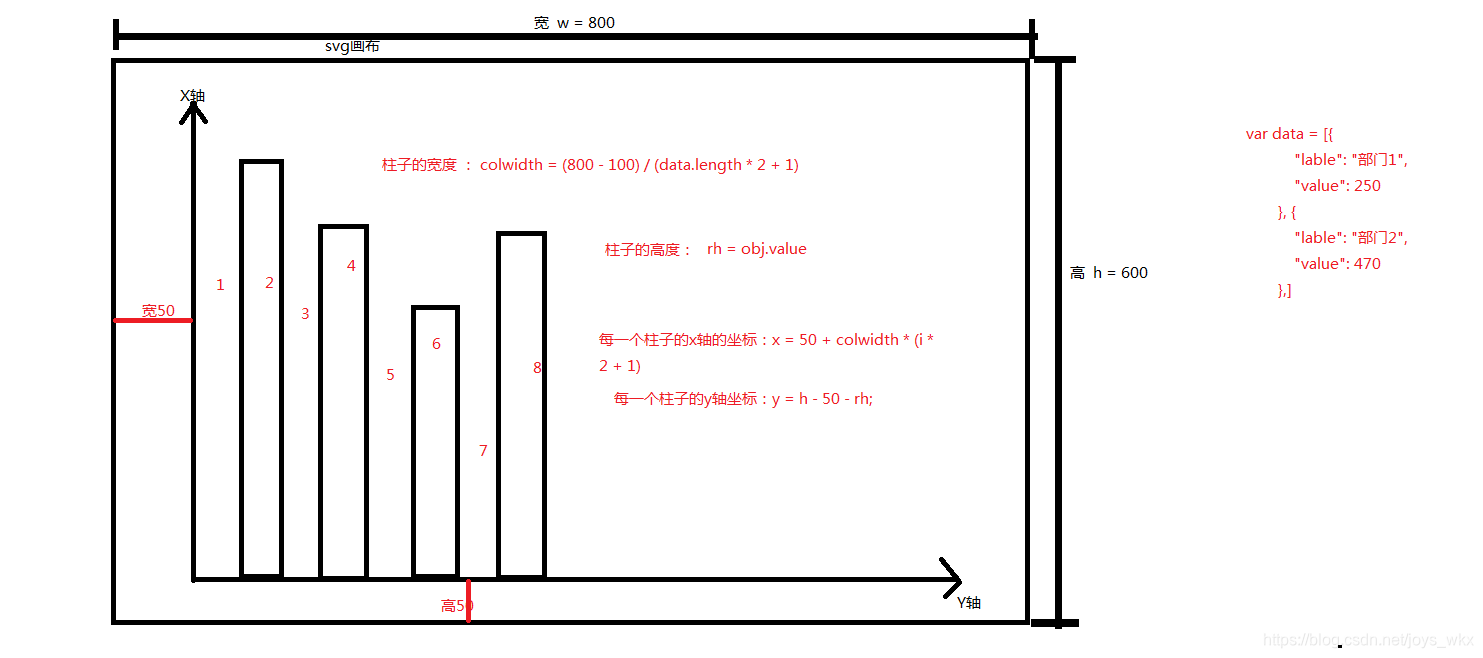
根据图片可以看出:
- 计算出每个柱子的宽度:colwidth = (800 - 100) / (data.length * 2 + 1) (柱子前后需要空隙)
- 柱子高度 : rh = obj.value;
来写代码:先在svg画布中
- 画x轴
 <!-- x 轴 -->
    <line x1="50" y1="50" x2="50" y2="553" stroke = "black" stroke-width = "4"></line>
    <line x1="50" y1="50" x2="40" y2="60" stroke = "black" stroke-width = "4"></line>
    <line x1="50" y1="50" x2="60" y2="60" stroke = "black" stroke-width = "4"></line>
- 画y轴
<!-- y轴 -->
    <line x1="50" y1="553" x2 = "750" y2 = "553" stroke = "black" stroke-width = "4"></line>
    <line x1="750" y1="553" x2="740" y2="543" stroke = "black" stroke-width = "4"></line>
    <line x1="750" y1="553" x2="740" y2="563" stroke = "black" stroke-width = "4"></line>
来一个数据
 var data = [{
            "lable": "部门1",
            "value": 250
        }, {
            "lable": "部门2",
            "value": 470
        }, {
            "lable": "部门3",
            "value": 200
        }, {
            "lable": "部门4",
            "value": 180
        }, {
            "lable": "部门5",
            "value": 100
        }, {
            "lable": "部门6",
            "value": 340
        }, ]
用for循环来画图
			var obj = data[i];//定义一个对象来装数据
            var rw = colwidth; //柱子宽度
            var rh = obj.value; //柱子高度
            var x = 50 + colwidth * (i * 2 + 1); //x轴的坐标
            var y = 600 - 50 - rh; //y轴的坐标
画单个的柱状图(矩形)
			var rect = document.createElementNS("http://www.w3.org/2000/svg", "rect");
            rect.setAttribute("width", rw);
            rect.setAttribute("height", rh);
            rect.setAttribute("x", x);
            rect.setAttribute("y", y);
            rect.setAttribute("fill", rc())//rc()随机颜色的函数
            svg.appendChild(rect);
柱状图上单个的数据
			var txt = document.createElementNS("http://www.w3.org/2000/svg", "text");
            txt.setAttribute("x", x + 12);
            txt.setAttribute("y", y - 5);
            txt.innerHTML = obj.value;
            svg.appendChild(txt);
x轴的部门显示
			var txt = document.createElementNS("http://www.w3.org/2000/svg", "text");
            txt.setAttribute("x", x + 8);
            txt.setAttribute("y", 580);
            txt.innerHTML = obj.lable;
            svg.appendChild(txt);
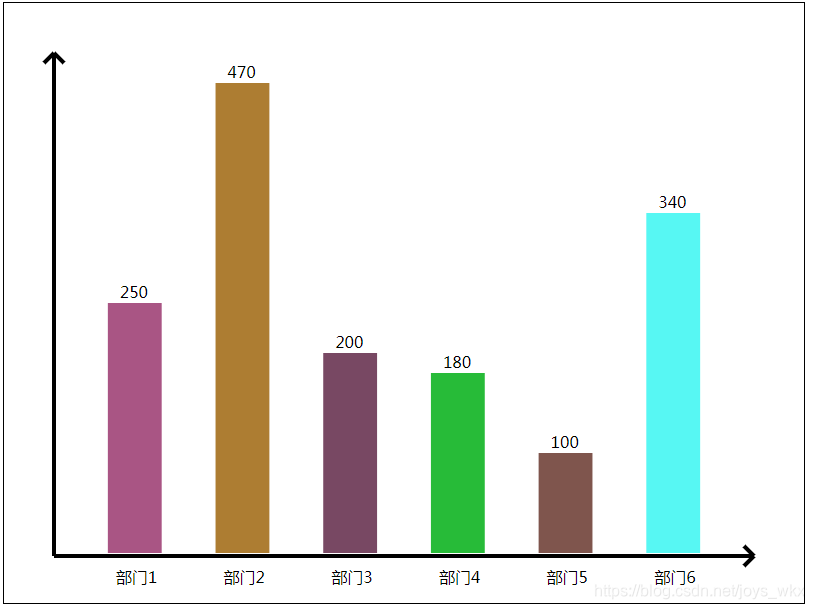
结果为:


 3186
3186

 被折叠的 条评论
为什么被折叠?
被折叠的 条评论
为什么被折叠?
 到【灌水乐园】发言


