


smaps文件内容格式是:
7f4913d8f000-7f4913ddd000 r-xp 00000000 fd:00 791940 /usr/local/boost149/lib/libboost_python.so.1.49.0
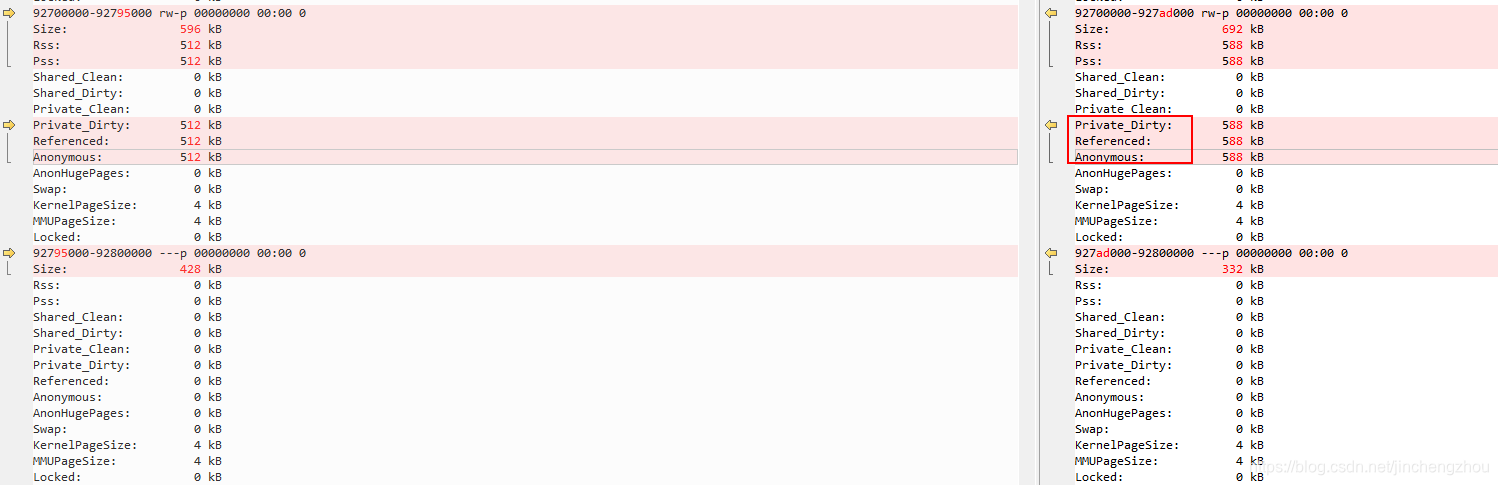
Size: 312 kB
Rss: 20 kB
Pss: 2 kB
Shared_Clean: 20 kB
Shared_Dirty: 0 kB
Private_Clean: 0 kB
Private_Dirty: 0 kB
Referenced: 20 kB
Anonymous: 0 kB
AnonHugePages: 0 kB
Swap: 0 kB
KernelPageSize: 4 kB
MMUPageSize: 4 kB
size: 是进程使用内存空间,并不一定实际分配了物理内存;
Rss: “Resident Set Size”,实际驻留”在内存中”的内存数. 不包括已经交换出去的页面。RSS还包括了与其它进程共享的内存区域,通常用于共享库;
Pss: Private Rss, Rss中私有的内存页面;
Shared_Clean: Rss中和其他进程共享的未改写页面;
Shared_Dirty: Rss和其他进程共享的已改写页面;
Private_Clean: Rss中改写的私有页面页面;
Private_Dirty: Rss中已改写的私有页面页面;
(其中Dirty页面如果没有交换机制的情况下,应该是不能回收的)
linux /proc/pid/smaps各字段含义
/proc/$PID/smaps
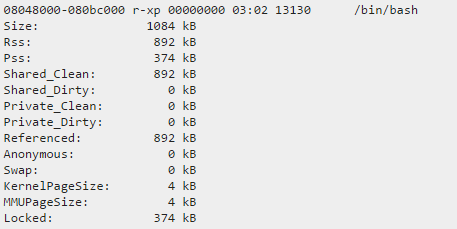
第一行:
08048000-080bc000 地址空间的开始地址 - 结束地址
r-xp 属性。前三个是rwx(读、写、可执行),如果不具有则为“-”。最后一个是p/s(私有/共享)
00000000 偏移量。如果这段内存是从文件里映射过来的,则偏移量为这段内容在文件中的偏移量。如果不是从文件里面映射过来的则为0.
03:02 If the region was mapped from a file, this is the major and minor device number (in hex) where the file lives.
13130 If the region was mapped from a file, this is the file number.
/bin/bash If the region was mapped from a file, this is the name of the file. This field is blank for anonymous mapped regions. There are also special regions with names like [heap], [stack], or [vdso]. [vdso] stands for virtual dynamic shared object. It’s used by system calls to switch to kernel mode.
Rss-Resident Set Size 实际使用物理内存(包含共享库占用的内存)
Rss=Shared_Clean+Shared_Dirty+Private_Clean+Private_Dirty
Pss 实际使用的物理内存(按比例包含共享库占用的内存)。比如四个进程共享同一个占内存1000MB的共享库,每个进程算进250MB在Pss。
Shared_Clean 、 Shared_Dirty 、 Private_Clean、 Private_Dirty
(shared/private)共享和私有
一个页的clean字段表示没有更改此页,当发生换页时不用写回。dirty表示更改了此页,当发生换页时要写回磁盘。此处这四个值是遍历页表中各个页后得到的。
“Referenced” indicates the amount of memory currently marked as referenced or accessed. “Anonymous” shows the amount of memory that does not belong to any file. Even a mapping associated with a file may contain anonymous pages: when MAP_PRIVATE and a page is modified, the file page is replaced by a private anonymous copy. “Swap” shows how much would-be-anonymous memory is also used, but out on swap.
linux环境内存分配原理 mallocinfo
《嵌入式Linux内存与性能详解》笔记2——进程内存优化
vld,Bounds Checker,memwatch,mtrace,valgrind,debug_new几种内存泄露检测工具的比较
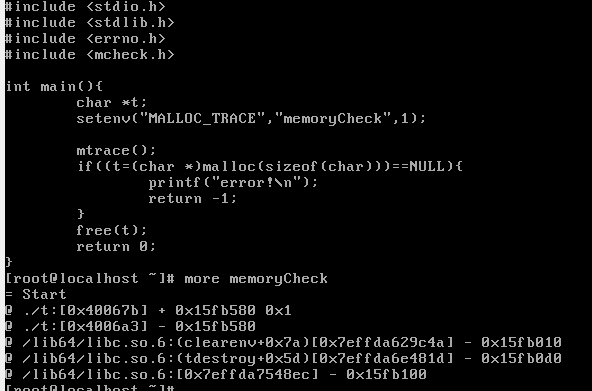
void main(void)
{
setenv("MALLOC_TRACE", "/mnt/hgfs/share/test/mtrace_output", 1);
mtrace();
int *p1 = (int*)malloc(sizeof(int));
int *p2 = (int*)malloc(sizeof(int));
free(p1);
muntrace();
return;
}
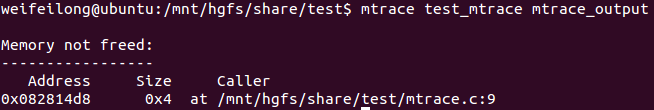
使用mtrace分析内存泄漏


 被折叠的 条评论
为什么被折叠?
被折叠的 条评论
为什么被折叠?
 到【灌水乐园】发言


