


 本文介绍如何使用PyEcharts在图表中任意位置插入文本,通过官方示例详细展示了如何设置文本的位置、样式及背景,适用于希望提升图表信息展示效果的数据可视化爱好者。
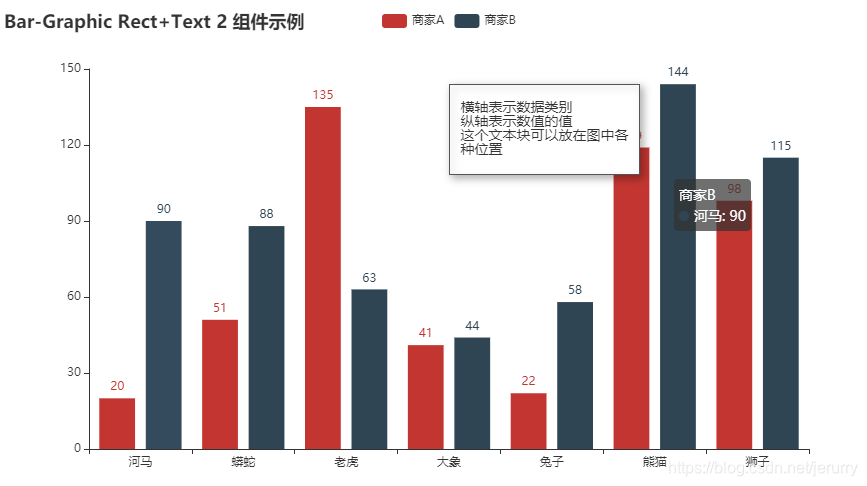
pyecharts在图表任意位置插入文本
官方示例
https://github.com/pyecharts/pyecharts/pull/1175/commits/692a55fe3ae0406b9921802d05d1bcc981c8b12a
def bar_graphic_rect_text_two_component() -> Bar:
    c = (
        Bar()
        .add_xaxis(Faker.choose())
        .add_yaxis("商家A", Faker.values())
        .add_yaxis("商家B", Faker.values())
        .set_global_opts(
            title_opts=opts.TitleOpts(title="Bar-Graphic Rect+Text 2 组件示例"),
            graphic_opts=[
                opts.GraphicGroup(
                    graphic_item=opts.GraphicItem(
                        # 控制整体的位置
                        left="50%",
                        top="15%",
                    ),
                    children=[
                        # opts.GraphicRect控制方框的显示
                        # 如果不需要方框,去掉该段即可
                        opts.GraphicRect(
                            graphic_item=opts.GraphicItem(
                                z=100,
                                left="center",
                                top="middle",
                            ),
                            graphic_shape_opts=opts.GraphicShapeOpts(
                                width=190, height=90,
                            ),
                            graphic_basicstyle_opts=opts.GraphicBasicStyleOpts(
                                fill="#fff",
                                stroke="#555",
                                line_width=2,
                                shadow_blur=8,
                                shadow_offset_x=3,
                                shadow_offset_y=3,
                                shadow_color="rgba(0,0,0,0.3)",
                            )
                        ),
                        # opts.GraphicText控制文字的显示
                        opts.GraphicText(
                            graphic_item=opts.GraphicItem(
                                left="center",
                                top="middle",
                                z=100,
                            ),
                            graphic_textstyle_opts=opts.GraphicTextStyleOpts(
                                # 可以通过jsCode添加js代码,也可以直接用字符串
                                text=JsCode(
                                    "['横轴表示数据类别',"
                                    "'纵轴表示数值的值',"
                                    "'这个文本块可以放在图中各',"
                                    "'种位置'].join('\\n')"
                                ),
                                font="14px Microsoft YaHei",
                                graphic_basicstyle_opts=opts.GraphicBasicStyleOpts(
                                    fill="#333"
                                )
                            )
                        )
                    ]
                )
            ],
        )
    )
    return c


 2万+
2万+

 被折叠的 条评论
为什么被折叠?
被折叠的 条评论
为什么被折叠?
 到【灌水乐园】发言


