


搜索的教程很多,但是很多不是自己想要找的,这里贴一个中文的官方教程,方便以后查阅。对于用到的一些内容,同步记录一下。
作图的时候,有时候要把几个不通的数据放到一起进行比较,还要调整画布的大小。使用subplots
函数说明如下:
matplotlib.subplots(nrows = 1, ncols = 1, *, sharex = False, sharey = False, squeeze = True, width_ratios = None, height_ratios = None, subplot_kw = None, gridspec_kw = None, ** fig_kw)其中nrows、ncols定义行列,即画一个nrows*ncols的子图
函数返回 Figure 和 Axes
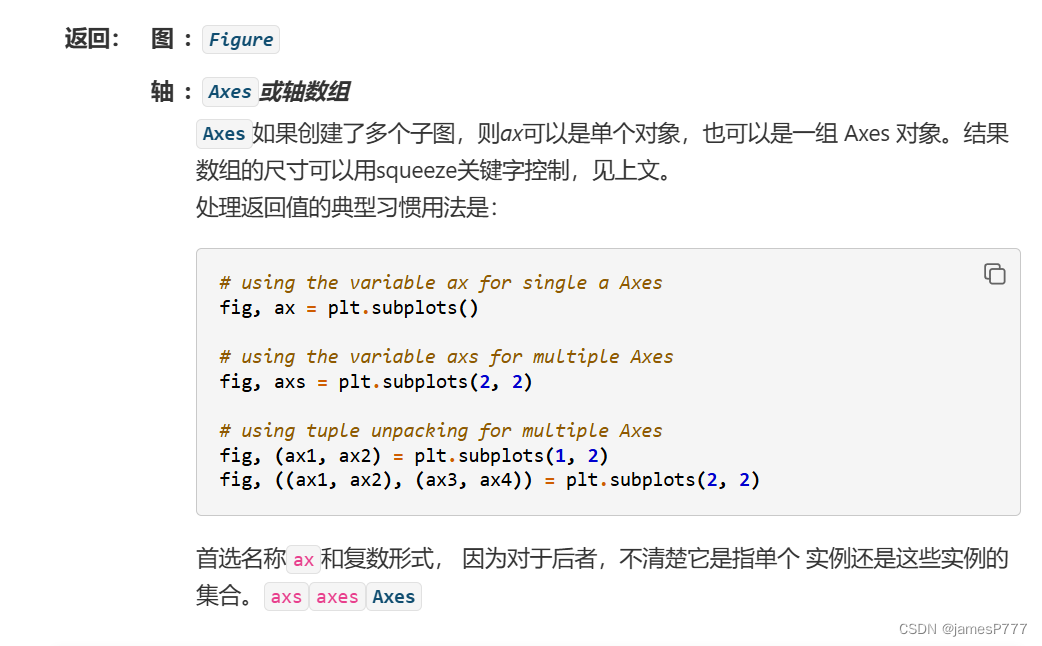
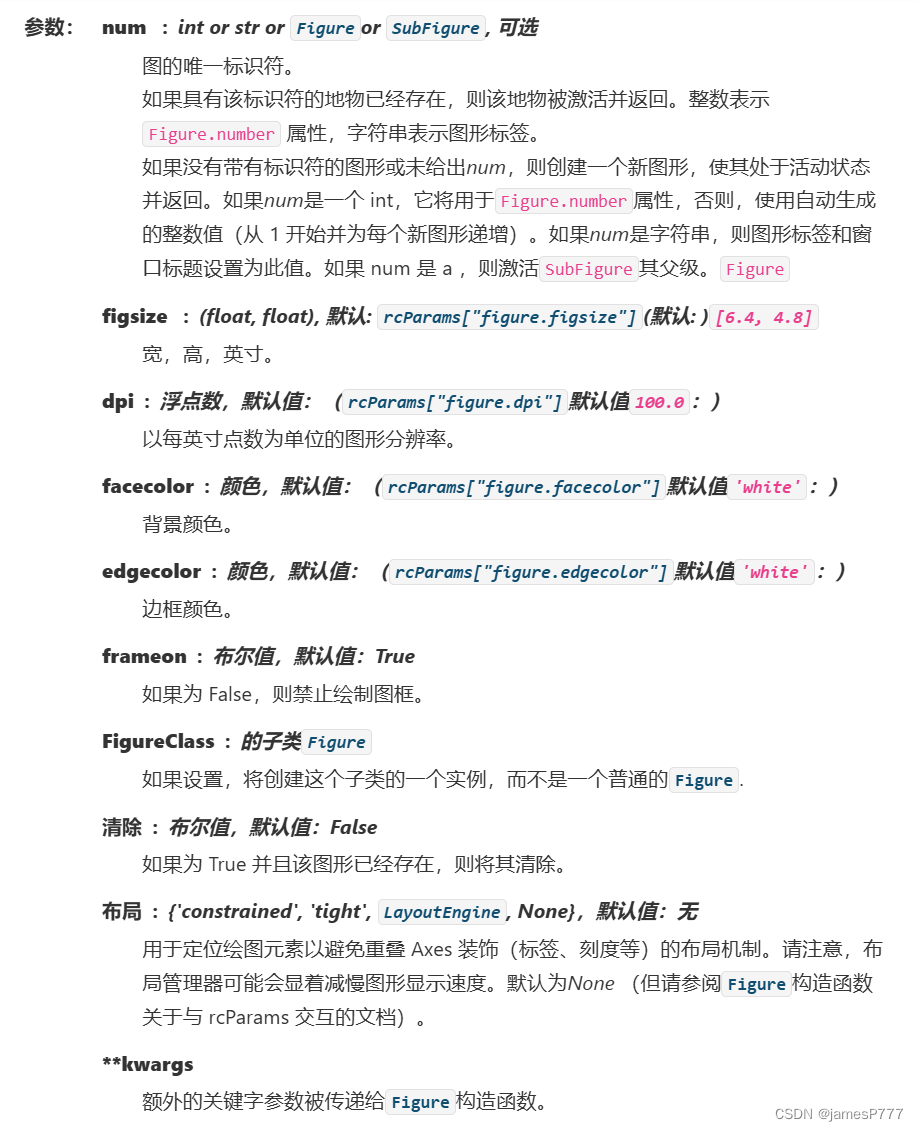
这里关注 ** figargs,可以传入 Figure的构造函数所用的参数
比如说,绘制2个相关性热力图 ,形成对比
fig, ax = plt.subplots(1,2,figsize=[24,12])
sns.heatmap(data.iloc[:,np.concatenate((x,m,w),axis=0) ].corr(), annot=True, fmt=".2f",ax=ax[0])
sns.heatmap(xnhdata.iloc[:,np.concatenate((x,m,w),axis=0) ].corr(), annot=True, fmt=".2f",ax=ax[1])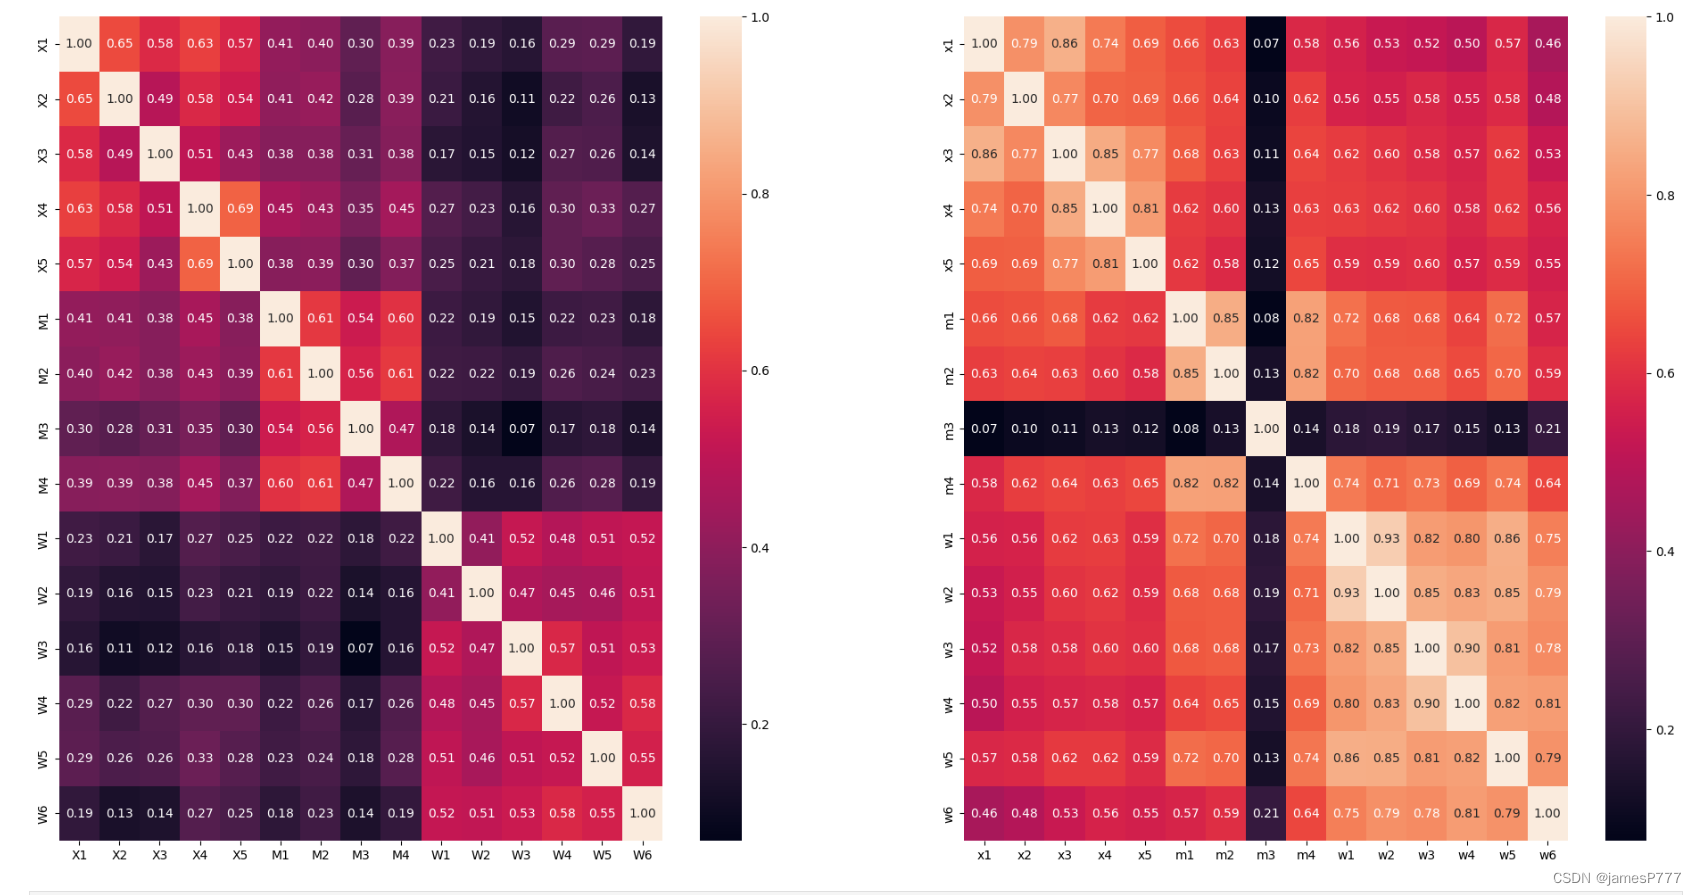


 被折叠的 条评论
为什么被折叠?
被折叠的 条评论
为什么被折叠?
 到【灌水乐园】发言


