


1.Trace跟踪参数
GC的简要信息:
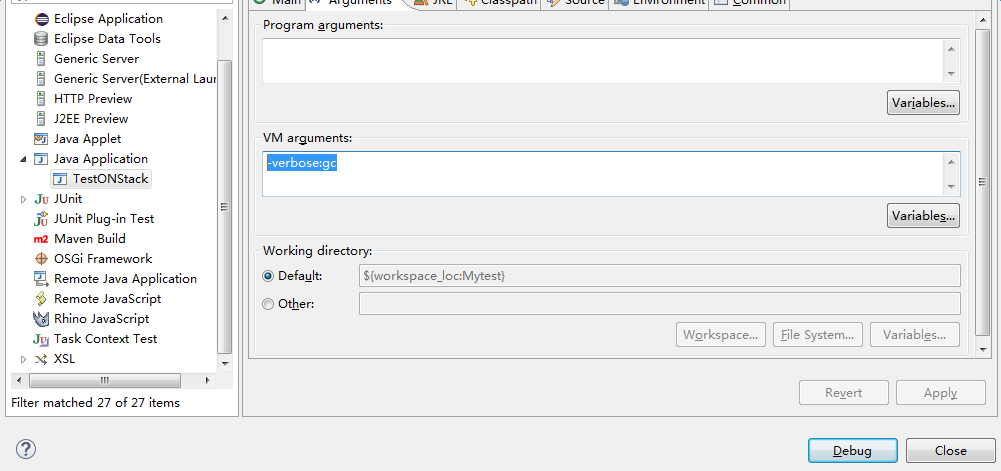
-verbose:gc
-xx:PrintGC
[GC4790K->374K(15872K), 0.0001606 secs]
初始堆空间4790K 到 374K 回收将近4M 整个堆的大小在16m左右 ,0.0001606 secs:用时
打印GC的详细信息:
-xx:PrintGCDetails ------>打印GC的详细信息
-xx:PrintGCTimeStamps---->打印GC发生的时间戳
列
[GC [PSYoungGen: 32640K->584K(38016K)] 32640K->584K(124864K), 0.0007259 secs] [Times: user=0.00 sys=0.00, real=0.00 secs]
-
real —— 程序从开始到结束所用的时钟时间。这个时间包括其他进程使用的时间片和进程阻塞的时间(比如等待 I/O 完成)。
-
user —— 进程执行用户态代码(核心之外)所使用的时间。这是执行此进程所使用的实际 CPU 时间,其他进程和此进程阻塞的时间并不包括在内。在垃圾收集的情况下,表示 GC 线程执行所使用的 CPU 总时间。
-
sys —— 进程在内核态消耗的 CPU 时间,即在内核执行系统调用或等待系统事件所使用的 CPU 时间。
user + sys 时间告诉我们程序执行实际使用的 CPU 时间。注意这里指所有的 CPU,因此如果在进程里有多个线程的话,这个时间可能会超过 real 所表示的时钟时间。
例1:
[Times: user=11.53 sys=1.38, real=1.03 secs]
在这个例子中,user + sys 时间的和比 real 时间要大,这主要是因为日志时间是从 JVM 中获得的,而这个 JVM 在多核的处理器上被配置了多个 GC 线程,由于多个线程并行地执行 GC,因此整个 GC 工作被这些线程共享,最终导致实际的时钟时间(real)小于总的 CPU 时间(user + sys)。
例2:
[Times: user=0.09 sys=0.00, real=0.09 secs]
上面的例子中的 GC 时间是从 Serial 垃圾收集器 (串行垃圾收集器)中获得的。由于 Serial 垃圾收集器是使用单线程进行垃圾收集的,因此 real 时间等于 user 和 sys 时间之和。
总结
在做性能优化时,我们一般采用 real 时间来优化程序。因为最终用户只关心点击页面发出请求到页面上展示出内容所花的时间,也就是响应时间,而不关心你到底使用了多少个 GC 线程或者处理器。但并不是说 sys 和 user 两个时间不重要,当我们想通过增加 GC 线程或者 CPU 数量来减少 GC 停顿时间时,可以参考这两个时间。
PSYoungGen total 669248K, used 483060K [0x00000007d5960000, 0x00000007fe7c0000, 0x0000000800000000)
eden space 668416K, 72% used [0x00000007d5960000,0x00000007f311d320,0x00000007fe620000)
from space 832K, 0% used [0x00000007fe6f0000,0x00000007fe6f0000,0x00000007fe7c0000)
to space 832K, 0% used [0x00000007fe620000,0x00000007fe620000,0x00000007fe6f0000)
ParOldGen total 86848K, used 488K [0x0000000780c00000, 0x00000007860d0000, 0x00000007d5960000)
object space 86848K, 0% used [0x0000000780c00000,0x0000000780c7a060,0x00000007860d0000)
PSPermGen total 21248K, used 2595K [0x000000077ba00000, 0x000000077cec0000, 0x0000000780c00000)
object space 21248K, 12% used [0x000000077ba00000,0x000000077bc88c70,0x000000077cec0000)
PSYoungGen:新生代 ParOldGen:老年代 PSPermGen :永久区
PSYoungGen --->total (669248K) = eden space(668416K)+from space(832K);
total (669248K)+缺省(复制算法所耗) = (0x00000007fe7c0000-0x00000007d5960000)/1024/1024
-XX:+PrintGCDetails -Xloggc:log/gc.log (注:项目路径下保证有log文件夹)
-Xloggc:log/gc.log
指定GC log的位置,以文件输出
帮助开发人员分析问题
-XX:+PrintHeapAtGC:
每次一次GC后,都打印堆信息
-XX:+TraceClassLoading:
监控类的加载
-XX:+PrintClassHistogram
按下Ctrl+Break后,打印类的信息
num #instances #bytes class name
序号 实例数量 总大小 类型
1: 890617 470266000 [B
2: 890643 21375432 java.util.HashMap$Node
3: 890608 14249728 java.lang.Long
4: 13 8389712 [Ljava.util.HashMap$Node;
5: 2062 371680 [C
6: 463 41904 java.lang.Class
2.堆的分配参数
-Xmx –Xms
-指定最大堆和最小堆
-java尽可能维持在最小堆
Xmx20m-Xms5m 运行代码:
System.out.print("Xmx=");
System.out.println(Runtime.getRuntime().maxMemory()/1024.0/1024+"M");
17.8125M 系统最大内存
System.out.print("free mem=");
System.out.println(Runtime.getRuntime().freeMemory()/1024.0/1024+"M");
6.14300537109375M 系统当前空闲 可用的内存
System.out.print("total mem=");
System.out.println(Runtime.getRuntime().totalMemory()/1024.0/1024+"M");
6.875M 系统一共现在分配的空间 总空间
已经使用 6.875M - 6.14300537109375M = 0.7 M (大约)
-----------------------------------------------------------------------------------------------------------
byte[] b=new byte[1*1024*1024];
System.out.print("Xmx=");
System.out.println(Runtime.getRuntime().maxMemory()/1024.0/1024+"M");
17.8125M 系统最大内存
System.out.print("free mem=");
System.out.println(Runtime.getRuntime().freeMemory()/1024.0/1024+"M");
5.2031097412109375M 系统当前空闲 可用的内存
System.out.print("total mem=");
System.out.println(Runtime.getRuntime().totalMemory()/1024.0/1024+"M");
6.875M 系统一共现在分配的空间 总空间
前面代码所得:已经使用 6.875M - 6.14300537109375M = 0.7 M (大约)
当前代码所得:已经使用 6.875M - 5.2031097412109375M= 1.7M(大约)(多使用了1M)
-------------------------------------------------------------------------
byte[] b=new byte[4*1024*1024];
System.out.print("Xmx=");
System.out.println(Runtime.getRuntime().maxMemory()/1024.0/1024+"M");
17.8125M 系统最大内存
System.out.print("free mem=");
System.out.println(Runtime.getRuntime().freeMemory()/1024.0/1024+"M");
6.2054901123046875M 系统当前空闲 可用的内存
System.out.print("total mem=");
System.out.println(Runtime.getRuntime().totalMemory()/1024.0/1024+"M");
10.9375M 系统一共现在分配的空间 总空间
前面代码所得:已经使用 6.875M - 6.14300537109375M = 0.7 M (大约)
当前代码所得:已经使用 10.9375M - 6.2054901123046875M= 4.7M(大约)(多使用了4M)
注:这里总内存变多了 做了扩容gc后如果内存还是不够,会进一步扩容
-------------------------------------------------------------------------
byte[] b=new byte[4*1024*1024];
System.gc();
System.out.print("Xmx=");
System.out.println(Runtime.getRuntime().maxMemory()/1024.0/1024+"M");
17.8125M 系统最大内存
System.out.print("free mem=");
System.out.println(Runtime.getRuntime().freeMemory()/1024.0/1024+"M");
6.2950897216796875M (6.2054901123046875M:不做GC前的大小) 系统当前空闲 可用的内存
System.out.print("total mem=");
System.out.println(Runtime.getRuntime().totalMemory()/1024.0/1024+"M");
10.9375M 系统一共现在分配的空间 总空间
相比之前空闲内存变大了
-Xmn: 设置新生代大小
-XX:NewRatio:
新生代(eden+2*s)和老年代(不包含永久区)的比值
4 表示 新生代:老年代=1:4,即年轻代占堆的1/5
-XX:SurvivorRatio
设置两个Survivor区和eden的比
8表示 两个Survivor :eden=2:8,即一个Survivor占年轻代的1/10
设置新生代大小为1M
-Xmx20m -Xms20m -Xmn1m -XX:+PrintGCDetails
byte[] b=null;
for(int i=0;i<10;i++)
{
b=new byte[1*1024*1024];
}
运行结果
Heap
PSYoungGen total 896K, used 673K [0x00000000fff00000, 0x0000000100000000, 0x0000000100000000)
eden space 768K, 87% used [0x00000000fff00000,0x00000000fffa8420,0x00000000fffc0000)
from space 128K, 0% used [0x00000000fffe0000,0x00000000fffe0000,0x0000000100000000)
to space 128K, 0% used [0x00000000fffc0000,0x00000000fffc0000,0x00000000fffe0000)
ParOldGen total 19456K, used 10240K [0x00000000fec00000, 0x00000000fff00000, 0x00000000fff00000)
object space 19456K, 52% used [0x00000000fec00000,0x00000000ff6000a0,0x00000000fff00000)
PSPermGen total 21248K, used 2591K [0x00000000f9a00000, 0x00000000faec0000, 0x00000000fec00000)
object space 21248K, 12% used [0x00000000f9a00000,0x00000000f9c87cf0,0x00000000faec0000)
1.没有触发GC
2. 新生代只有768k 不够放1M 所以全部都被放到了老年代
新生代 调整到了15M
-Xmx20m -Xms20m -Xmn15m -XX:+PrintGCDetails
byte[] b=null;
for(int i=0;i<10;i++)
{
b=new byte[1*1024*1024];
}
Heap
PSYoungGen total 13440K, used 11449K [0x00000000ff100000, 0x0000000100000000, 0x0000000100000000)
eden space 11520K, 99% used [0x00000000ff100000,0x00000000ffc2e418,0x00000000ffc40000)
from space 1920K, 0% used [0x00000000ffe20000,0x00000000ffe20000,0x0000000100000000)
to space 1920K, 0% used [0x00000000ffc40000,0x00000000ffc40000,0x00000000ffe20000)
ParOldGen total 5120K, used 0K [0x00000000fea00000, 0x00000000fef00000, 0x00000000ff100000)
object space 5120K, 0% used [0x00000000fea00000,0x00000000fea00000,0x00000000fef00000)
PSPermGen total 21248K, used 2591K [0x00000000f9800000, 0x00000000facc0000, 0x00000000fea00000)
object space 21248K, 12% used [0x00000000f9800000,0x00000000f9a87cf0,0x00000000facc0000)
1.没有触发GC
2.全部都分配到了eden
3.老年代 没有使用
新生代 调整到了7M
-Xmx20m -Xms20m -Xmn7m -XX:+PrintGCDetails
byte[] b=null;
for(int i=0;i<10;i++)
{
b=new byte[1*1024*1024];
}
[GC [PSYoungGen: 4938K->600K(6272K)] 4938K->1624K(19584K), 0.0006429 secs] [Times: user=0.00 sys=0.00, real=0.00 secs]
[GC [PSYoungGen: 4972K->568K(6272K)] 5996K->2616K(19584K), 0.0005536 secs] [Times: user=0.00 sys=0.00, real=0.00 secs]
Heap
PSYoungGen total 6272K, used 2709K [0x00000000ff900000, 0x0000000100000000, 0x0000000100000000)
eden space 5376K, 39% used [0x00000000ff900000,0x00000000ffb177a8,0x00000000ffe40000)
from space 896K, 63% used [0x00000000fff20000,0x00000000fffae030,0x0000000100000000)
to space 896K, 0% used [0x00000000ffe40000,0x00000000ffe40000,0x00000000fff20000)
ParOldGen total 13312K, used 2048K [0x00000000fec00000, 0x00000000ff900000, 0x00000000ff900000)
object space 13312K, 15% used [0x00000000fec00000,0x00000000fee00020,0x00000000ff900000)
PSPermGen total 21248K, used 2594K [0x00000000f9a00000, 0x00000000faec0000, 0x00000000fec00000)
object space 21248K, 12% used [0x00000000f9a00000,0x00000000f9c88938,0x00000000faec0000)
1.发生了两次GC
2.有部分在老年代,s0 s1 太小 需要老年代担保
新生代 调整到了7M
-Xmx20m -Xms20m -Xmn7m -XX:SurvivorRatio=2 -XX:+PrintGCDetails
byte[] b=null;
for(int i=0;i<10;i++)
{
b=new byte[1*1024*1024];
}
[GC [PSYoungGen: 2766K->1592K(5376K)] 2766K->1592K(18688K), 0.0008951 secs] [Times: user=0.00 sys=0.00, real=0.00 secs]
[GC [PSYoungGen: 4850K->1560K(5376K)] 4850K->1560K(18688K), 0.0008494 secs] [Times: user=0.00 sys=0.00, real=0.00 secs]
[GC [PSYoungGen: 4660K->1544K(5376K)] 4660K->1544K(18688K), 0.0005483 secs] [Times: user=0.00 sys=0.00, real=0.00 secs]
Heap
PSYoungGen total 5376K, used 3646K [0x00000000ff900000, 0x0000000100000000, 0x0000000100000000)
eden space 3584K, 58% used [0x00000000ff900000,0x00000000ffb0dac8,0x00000000ffc80000)
from space 1792K, 86% used [0x00000000ffc80000,0x00000000ffe02030,0x00000000ffe40000)
to space 1792K, 0% used [0x00000000ffe40000,0x00000000ffe40000,0x0000000100000000)
ParOldGen total 13312K, used 0K [0x00000000fec00000, 0x00000000ff900000, 0x00000000ff900000)
object space 13312K, 0% used [0x00000000fec00000,0x00000000fec00000,0x00000000ff900000)
PSPermGen total 21248K, used 2594K [0x00000000f9a00000, 0x00000000faec0000, 0x00000000fec00000)
object space 21248K, 12% used [0x00000000f9a00000,0x00000000f9c88938,0x00000000faec0000)
1.发生了3次GC
2.s0 ,s1增大
-XX:+HeapDumpOnOutOfMemoryError
–OOM时导出堆到文件
-XX:+HeapDumpPath
–导出OOM的路径
-Xmx20m -Xms5m -XX:+HeapDumpOnOutOfMemoryError -XX:HeapDumpPath=d:/a.dump
– Vector v=newVector();
– for(int i=0;i<25;i++)
– v.add(new byte[1*1024*1024]);
-XX:OnOutOfMemoryError
–在OOM时,执行一个脚本
–"-XX:OnOutOfMemoryError=D:/tools/jdk1.7_40/bin/printstack.bat %p“
– 当程序OOM时,在D:/a.txt中将会生成线程的dump
–可以在OOM时,发送邮件,甚至是重启程序
D:/tools/jdk1.7_40/bin/jstack -F %1 >D:/a.txt
总结:
根据实际事情调整新生代和幸存代的大小
官方推荐新生代占堆的3/8
幸存代占新生代的1/10
在OOM时,记得Dump出堆,确保可以排查现场问题
-XX:PermSize -XX:MaxPermSize
设置永久区的初始空间和最大空间
他们表示,一个系统可以容纳多少个类型 (一般几百kb)
如果堆空间没有用完也抛出了OOM有可能是永久区导致的
3.栈的分配参数
-Xss
通常只有几百K
决定了函数调用的深度
每个线程都有独立的栈空间 (越小容纳的线程越多)
局部变量、参数 分配在栈上
public static void test(long a,long b,long c){
count++;
test(a,b,c);
}
public static void main(String args[]){
try{
test(0L,0L,0L);
}catch(Throwable e){
System.out.println("deep of calling = "+count);
e.printStackTrace();
}
}
递归调用
-Xss128K
deep of calling = 685
java.lang.StackOverflowError
递归调用
-Xss128K
deep of calling = 1708
java.lang.StackOverflowError


 被折叠的 条评论
为什么被折叠?
被折叠的 条评论
为什么被折叠?
 到【灌水乐园】发言


