


 本文介绍了如何利用Docker在Linux系统上部署Prometheus和Grafana,监控系统性能。首先,确保安装了Docker,然后拉取node-exporter、Prometheus和Grafana的镜像。启动node-exporter并验证其运行状态。接着配置Prometheus,创建prometheus.yml文件,设置数据源为node-exporter。启动Prometheus后,检查目标状态。最后,安装并配置Grafana,导入Node Exporter的模板文件,完成监控页面的展示。
环境准备
linux上安装docker,如果你的机器上还没有安装docker可以参考这篇文章:
docker拉取node-exporter,prometheus,grafana镜像,命令如下:
docker pull prom/node-exporter
docker pull prom/prometheus
docker pull grafana/grafana如果想要安装指定版本,可以去docker官网搜索版本安装:Docker Hub
启动node-exporter
docker run -d -p 9100:9100 --name=node_exporter 镜像Id
查看端口是否被监听:
netstat -anpt | grep 9100
验证是否安装成功,访问URL http://192.168.36.131:9100/metrics
启动prometheus
进入容器查看默认的配:
docker exec -it 容器ID /bin/shglobal:
scrape_interval: 15s # Set the scrape interval to every 15 seconds. Default is every 1 minute.
evaluation_interval: 15s # Evaluate rules every 15 seconds. The default is every 1 minute.
# scrape_timeout is set to the global default (10s).
# Alertmanager configuration
alerting:
alertmanagers:
- static_configs:
- targets:
# - alertmanager:9093
# Load rules once and periodically evaluate them according to the global 'evaluation_interval'.
rule_files:
# - "first_rules.yml"
# - "second_rules.yml"
# A scrape configuration containing exactly one endpoint to scrape:
# Here it's Prometheus itself.
scrape_configs:
# The job name is added as a label `job=<job_name>` to any timeseries scraped from this config.
- job_name: "prometheus"
# metrics_path defaults to '/metrics'
# scheme defaults to 'http'.
static_configs:
- targets: ["localhost:9090"]- 创建prometheus.yml 文件
global:
  scrape_interval:     60s
  evaluation_interval: 60s

scrape_configs:
  - job_name: prometheus
    static_configs:
      - targets: ['localhost:9090']
        labels:
          instance: prometheus

  - job_name: linux
    static_configs:
      - targets: ['192.168.91.132:9100']
        labels:
          instance: localhost
讲解下配置文件:
global主要配置全局间隔拉取数据时间,主要修改static_configs配置,修改targets的ip地址为你上面的node-exporter地址,端口号默认为9100
创建容器:
docker run -d -p 9090:9090 -v /docker/prometheus/prometheus.yml:/etc/prometheus/prometheus.yml --name=prometheus 3313ec19d029 镜像ID验证是否安装成功
访问targets: http://IP地址:9090/targets
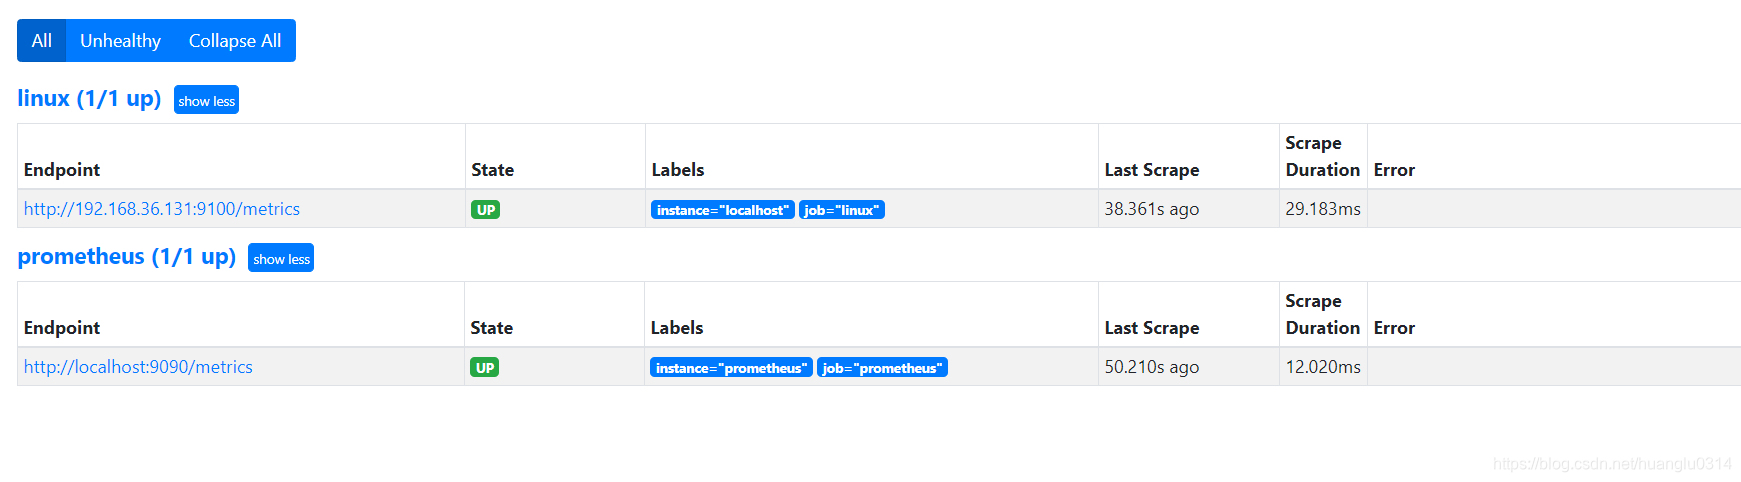
只要他们的状态为up即可
下面是启动grafana,grafana的安装启动,可以看这一篇文章:使用docker搭建Grafana+influx 实时监控Jmeter压测平台
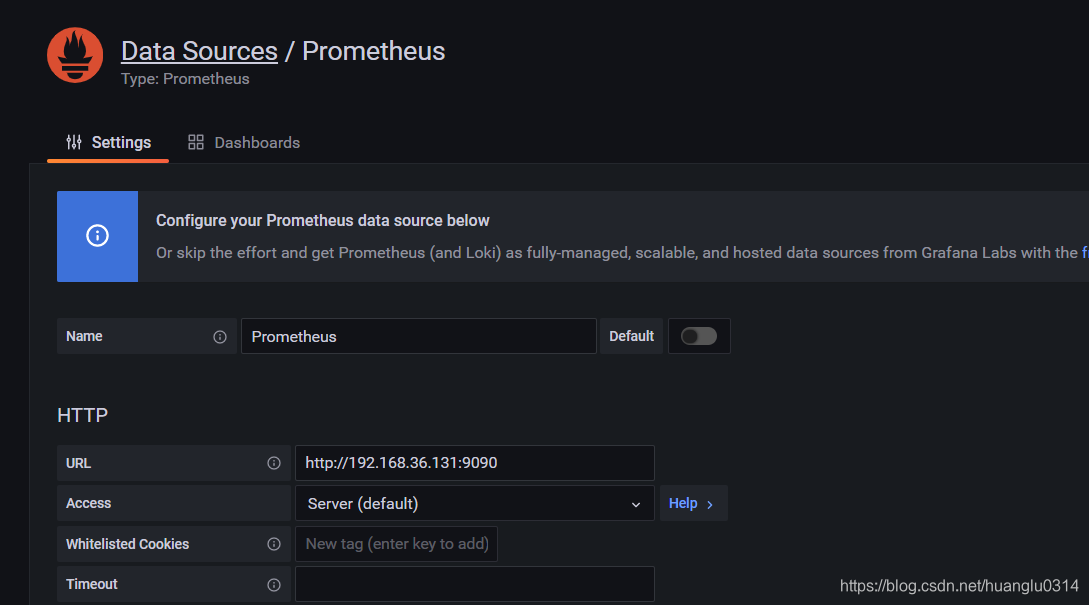
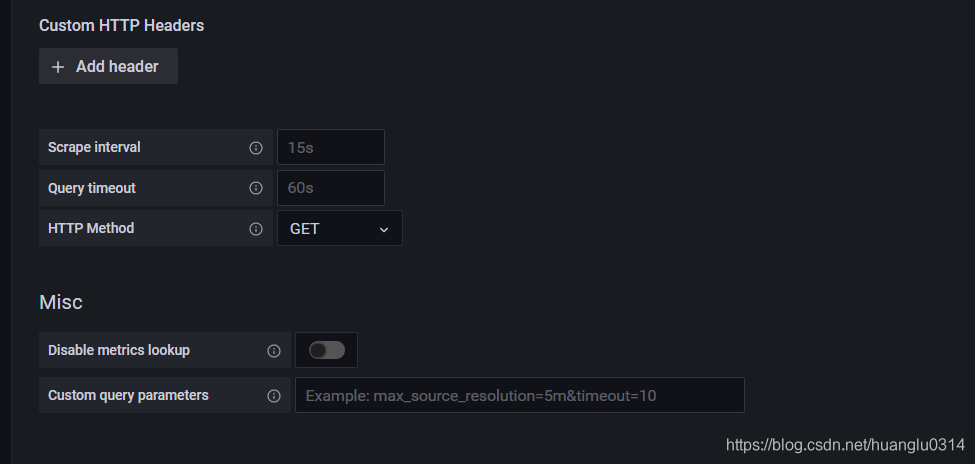
之后就是配置promethues数据源:
点击设置,选择数据源,配置数据源:
之后选择控制面板:
可以去官网选择模板:Dashboards | Grafana Labs
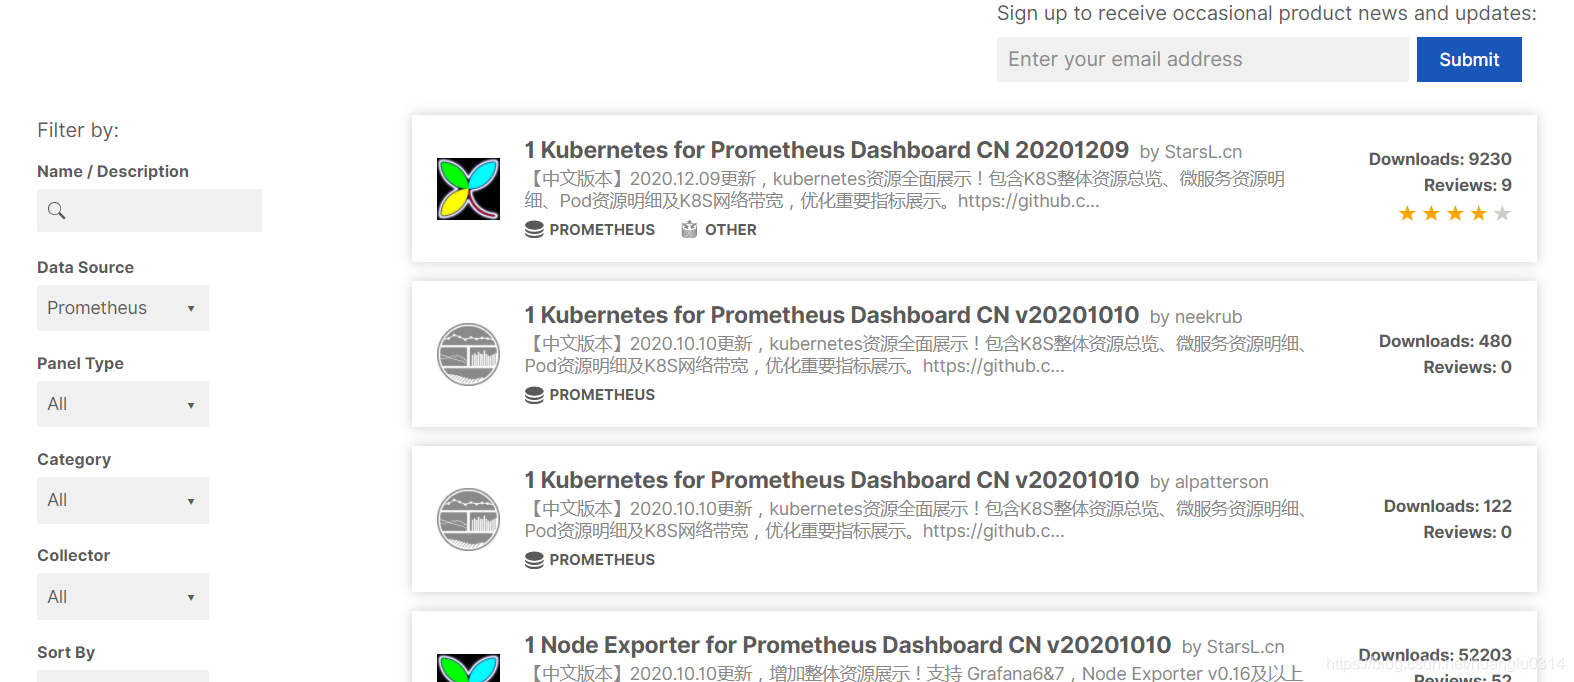
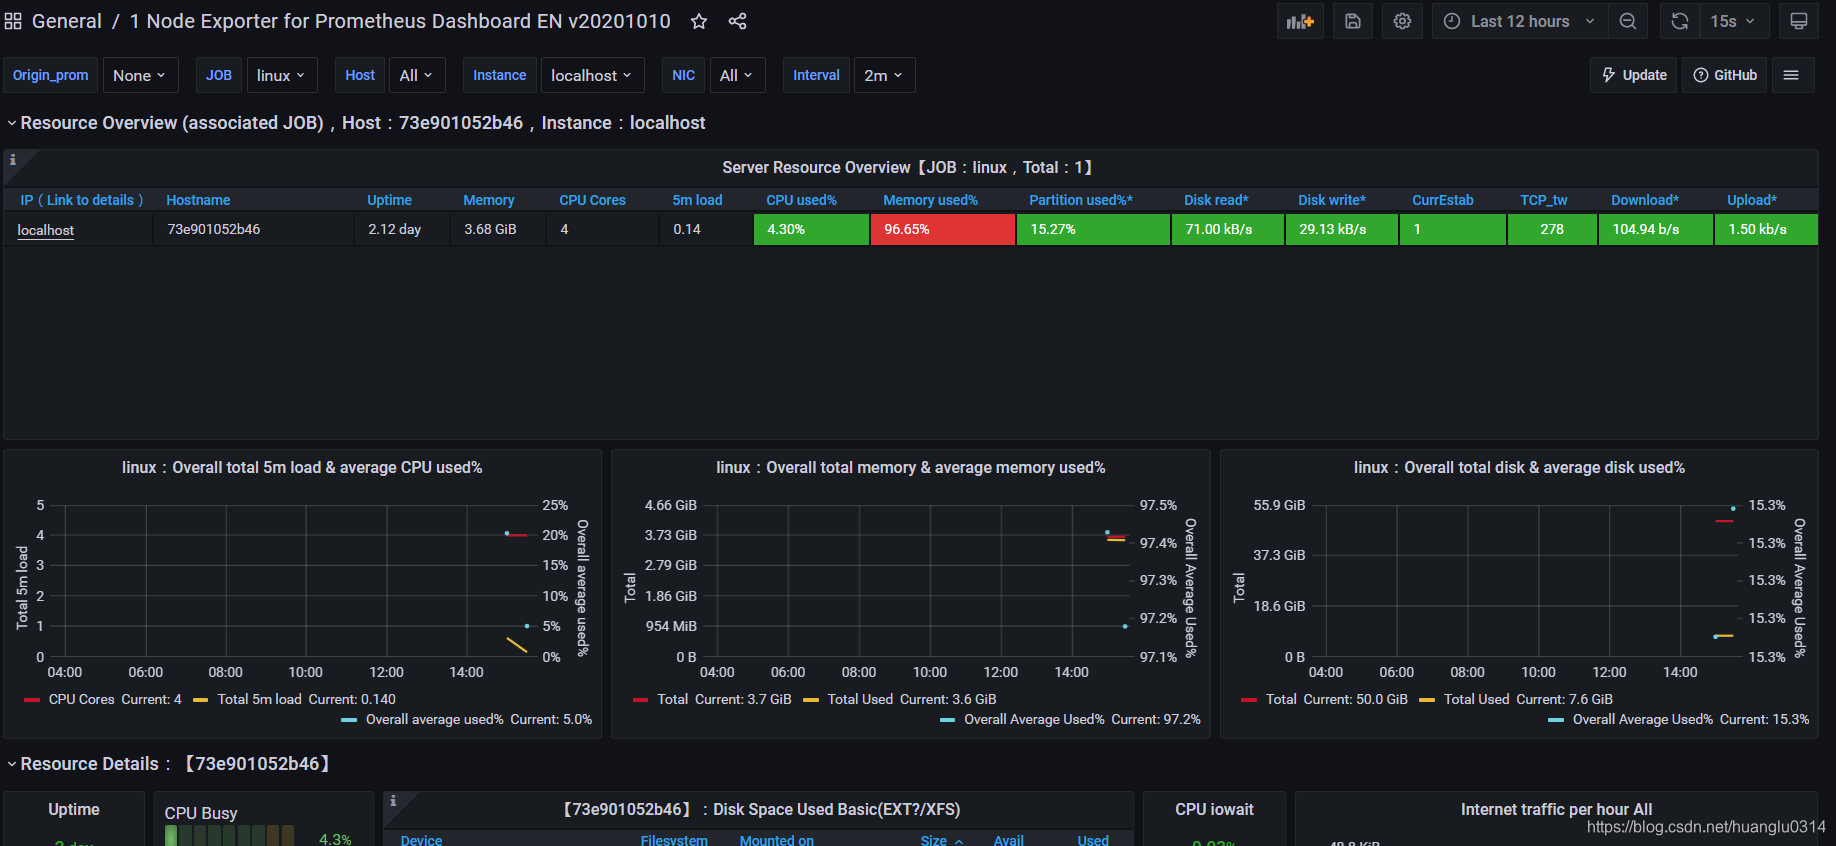
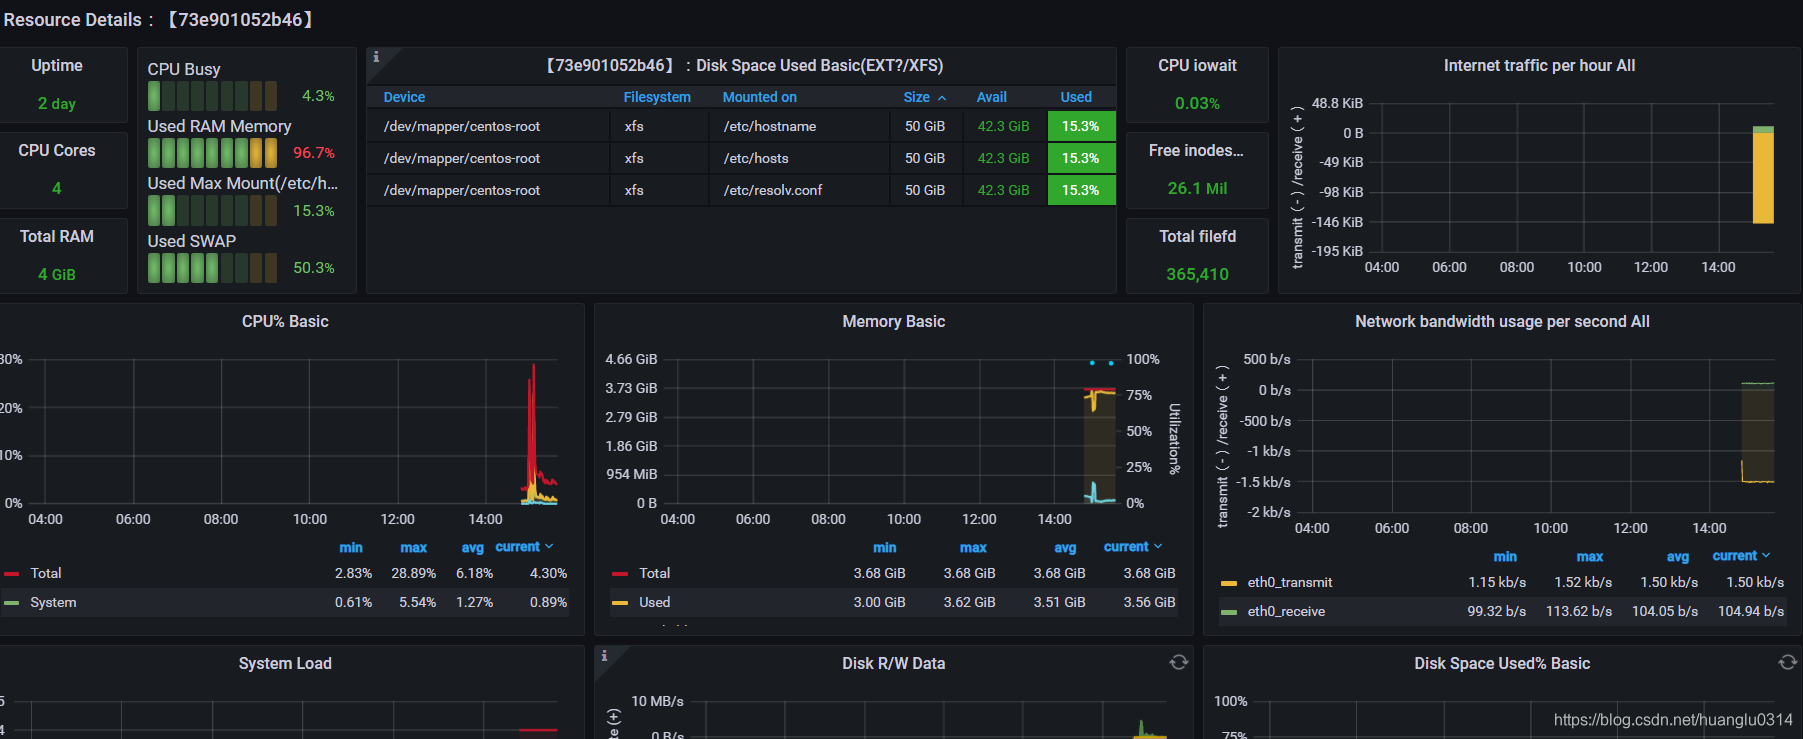
我们选择ID为11074的模板文件,下载链接为:1 Node Exporter for Prometheus Dashboard EN v20201010 dashboard for Grafana | Grafana Labs
最后显示的页面如下:


 850
850

 被折叠的 条评论
为什么被折叠?
被折叠的 条评论
为什么被折叠?
 到【灌水乐园】发言


