matplotlib使用
简单折线图
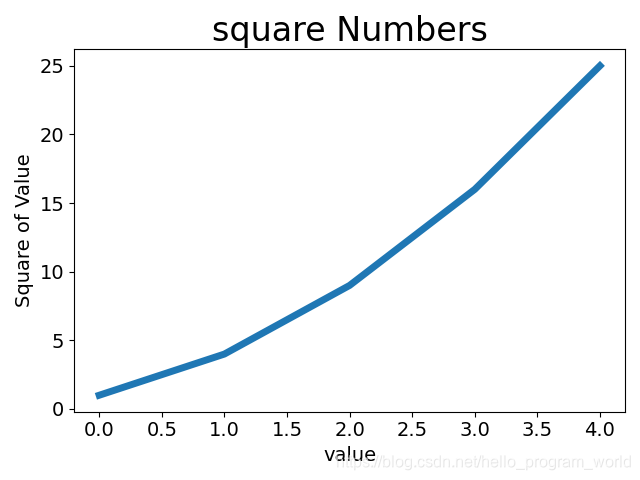
# plot()默认第一个点对应的x坐标值为0
# 绘制简单折线图
squares=[1,4,9,16,25]
# 设置线条粗细
plt.plot(squares,linewidth=5)
# 设置标题
plt.title("square Numbers", fontsize=24)
# 给坐标轴加标签
plt.xlabel("value",fontsize=14)
plt.ylabel("Square of Value",fontsize=14)

# 设置刻度样式
plt.tick_params(axis='both',labelsize=14)

plt.show()
矫正图形
input_values=[1,2,3,4,5]
squares=[1,4,9,16,25]
plt.plot(input_values,squares,linewidth=5)

# 设置标题
plt.title("square Numbers", fontsize=24)
# 给坐标轴加标签
plt.xlabel("value",fontsize=14)
plt.ylabel("Square of Value",fontsize=14)

# 设置刻度样式
plt.tick_params(axis='both',labelsize=14)
plt.show()

简单散点图


 本文介绍了Python中matplotlib库的使用,包括绘制简单折线图、矫正图形、散点图,以及设置颜色映射、自动保存图表等。同时,也探讨了pygal库,展示了如何绘制直方图和两条折线并填充中间部分。
 最低0.47元/天 解锁文章


 到【灌水乐园】发言


