


 本文介绍了使用Grapher Automation创建和设置图形对象,特别是如何绘制彩色渐变剖面图。内容涵盖Application Object、AutoPlot和AutoGraph对象,以及AddLinePlotGraph方法、坐标轴设置等,详细阐述了绘图过程和关键步骤。
Application Object
Application 对象是Grapher Automation的顶级对象,包括其他对象。
The Application object represents the Grapher program. It is a single instance of Grapher and it is the root of all objects in Grapher. External programs typically create an instance of the Application object during initialization**. In VB this is done using the CreateObject function as in:**
Set GrapherApp = CreateObject(“Grapher.Application”)
The CreateObject function activates a new instance of Grapher, and returns a reference to the Application object to the script.
When Grapher is started by a script, its main window is initially hidden. To make the Grapher window visible, you must set the Application object’s Visible property to True:
当grapher由脚本启动时,其主窗口最初是隐藏的。若要使图示器窗口可见,必须将应用程序对象的Visible属性设置为true:
Set GrapherApp = CreateObject(“Grapher.Application”)
GrapherApp.Visible = True
AutoPlot Object
The AutoPlot object is the basic plot object from which most plots are derived.
autoplot对象是基本绘图对象,大多数的绘图都是由它派生的。
Derived from: AutoShape object (All methods and properties of AutoShape apply to this object.)
派生自:AutoShape object,继承了AutoShape object的所有对象和方法(AutoShape object的所有方法和属性都应用于此对象。)
Dim GrapherApp As Object
Set GrapherApp = CreateObject(“Grapher.Application”) '创建Grapher.Applicatio对象
GrapherApp.Visible = True’设置grapher窗口可见
Dim Plot As Object
Set Plot = GrapherApp.Documents.Add(grfPlotDoc)'AutoPlot 对象
Dim Shapes As Object
Set Shapes = Plot.Shapes’shapes对象
AutoGraph Object
AutoGraph 对象包含对Graph(图形)的设置
Dim GrapherApp As Object
Set GrapherApp = CreateObject(“Grapher.Application”) '创建Grapher.Applicatio对象
GrapherApp.Visible = True’设置grapher窗口可见
Dim Plot As Object
Set Plot = GrapherApp.Documents.Add(grfPlotDoc)'AutoPlot 对象
Dim Shapes As Object
Set Shapes = Plot.Shapes’shapes对象
Dim Graph1 As Object’下面给Shapes对象添加图形
Set Graph1 = Shapes.AddLinePlotGraph(GrapherApp.Path + “\samples\bar chart orientations.dat”)
AddLinePlotGraph 方法
函数创建一个新的 2D line/scatter plot. 返回 AutoGraph 对象.
语法如下:
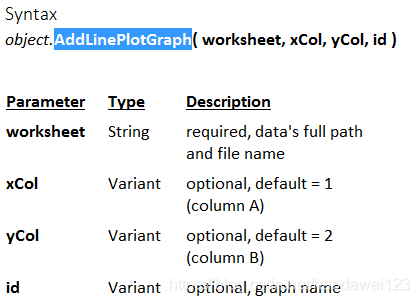
指定,x,y id是graph的名字
AddLinePlot 方法
The AddLinePlot method adds a 2D line/scatter plot to an existing 2D graph, equivalent to Graph | Add to Graph | Plot. Returns an AutoLinePlot object.
** Call Graph1.AddLinePlot(App.Path + “” + dataFileName, 2, 3) '添加剖面**
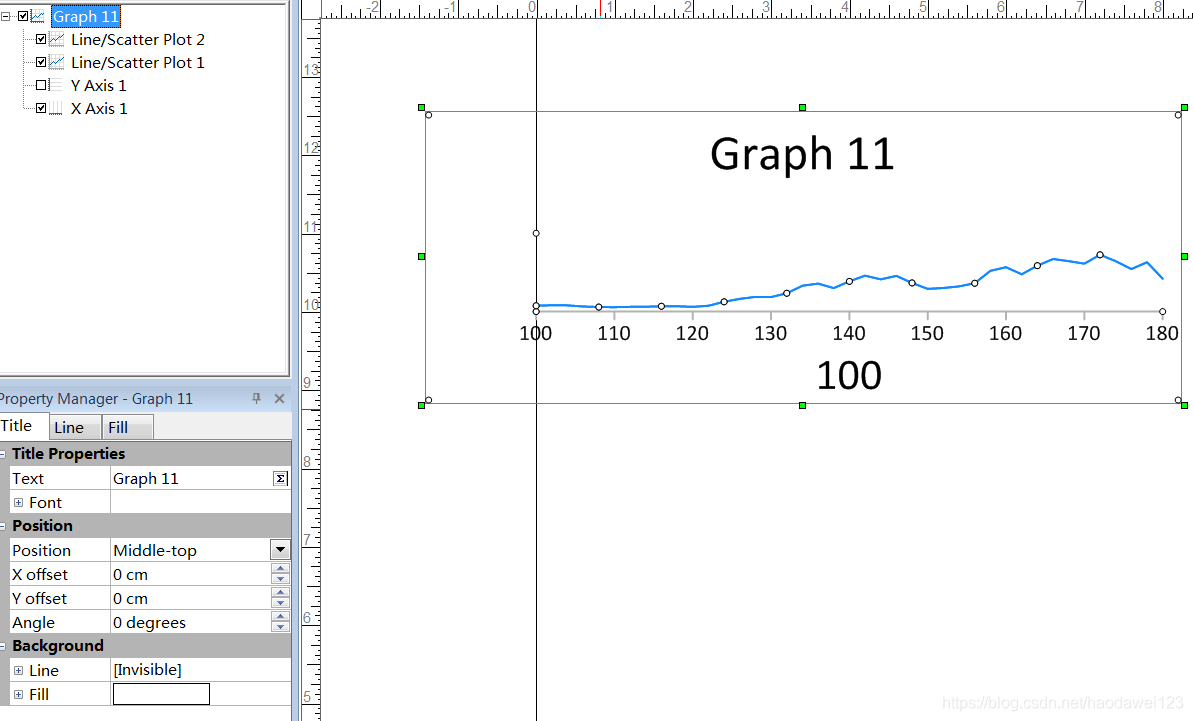
下面的图就是一个Graph如左下角的属性窗口,Graph11有个TiTle对象,title下面又有个Text属性,我们可以通过给这个Text设置为空来去掉“Graph 11”这个标题。
AutoAxes Collection
AutoAxes 集合包含图形的所有坐标轴(如x,y轴)。AutoAxes 集合中的每一个成员都是AutoAxis对象,可以通过AutoAxis对象来设置坐标轴的一些属性。
axes(1) 指向 Graph底部x轴
axes(2)指向Graph左边的y轴
AutoAxis Object
AutoAxis 对象指向Graph中的坐标轴,通过这个对象修改坐标轴的各种设置。
'Assigns the X axis to the variable named “Axis”
Set Axis = Axes(1)
grapher1.Title.Text = “”'设置Graph的标题为空
Set axes = grapher1.axes 'axes指向 grapher1.axes集合
Set axis1 = axes(1) '底部坐标轴,x
Set gtitle = axis1.Title
gtitle.Text = “”
axis1.length = xxLength
axis1.Left = xxLeft
axis1.Top = xxTop
axis1.AutoMax = False
axis1.AutoMin = False
axis1.Min = mMinX '设置x轴的开始位置
axis1.Max = mMaxX
Set Tickmarks = axis1.Tickmarks '设置tick mark的长度
Tickmarks.MajorLength = 0.1
Tickmarks.MinorLength = 0.05
Set TickLabels = axis1.TickLabels '设置标注
TickLabels.MajorOffset = 0
Set MajorFont = TickLabels.MajorFont '设置字体
MajorFont.Size = 8
Set axis2 = axes(2) '左边坐标轴,y
axis2.Visible = False '设置不可见
axis2.length = yyLength
axis2.Left = yyLeft
axis2.Top = yyTop
axis2.AutoMax = False
axis2.AutoMin = False
axis2.Max = mMaxY
axis2.Min = mMinY '设置Y轴与X轴的交点位置既是开始位置
Grapher 绘制彩色渐变剖面平面图原理
1、根据设置的数据的最大值、最小值、颜色、色阶的数量,计算每一阶的数值范围与颜色值。
2、在一个Graph内绘制多个剖面图并填充颜色,将这些剖面按照从底到顶按照由大到小的顺序排列。
3、设置Graph的位置等参数
vb核心代码:
Public Sub drawfd(dataFileName As String, xn As Integer, yn As Integer, fdn As Integer, Shapes As Object, sx As Boolean) '绘制分段彩色平剖图,fdn指示分段的数目,sx绘图的顺序=false表示在x轴以下
Dim str As String
Dim bh As Integer '颜色编号
Dim ys As Long '颜色值
Dim n As Integer
If sx = True Then
Set grapher1 = Shapes.AddLinePlotGraph(dataFileName, xn, yn) 'AddLinePlotGraphAddLinePlot
Else
Set grapher1 = Shapes.AddLinePlotGraph(dataFileName, xn, yn) 'AddLinePlotGraphAddLinePlot
End If
grapher1.Title.Text = “”
Set axes = grapher1.axes
Set axis1 = axes(1) '底部坐标轴,x
axis1.Title.Text = “”
axis1.length = xxLength
axis1.Left = xxLeft
axis1.Top = xxTop
axis1.AutoMax = False
axis1.AutoMin = False
axis1.Min = mMinX '设置x轴的开始位置
axis1.Max = mMaxX
Set Tickmarks = axis1.Tickmarks '设置tick mark的长度
Tickmarks.MajorLength = 0.1
Tickmarks.MinorLength = 0.05
Set TickLabels = axis1.TickLabels '设置标注
TickLabels.MajorOffset = 0
Set MajorFont = TickLabels.MajorFont '设置字体
MajorFont.Size = 8
Set axis2 = axes(2) '左边坐标轴,y
axis2.Visible = False '设置不可见
axis2.length = yyLength
axis2.Left = yyLeft
axis2.Top = yyTop
axis2.AutoMax = False
axis2.AutoMin = False
axis2.Max = mMaxY '此处要先设置Y轴的最大值,然后再设置Y轴的最小值,要不会出现最小值大于最大值的错误
axis2.Min = mMinY '设置Y轴与X轴的交点位置既是开始位置
Set Tickmarks = axis2.Tickmarks '设置标注长度
Tickmarks.MajorLength = 0.1
Tickmarks.MinorLength = 0.05
Set TickLabels = axis2.TickLabels '设置标注文子
TickLabels.MajorOffset = 0
Set MajorFont = TickLabels.MajorFont '设置字体
MajorFont.Size = 8
'Debug.Print Tickmarks.FirstTickValue
Dim FillFormat As Object
'Debug.Print grapher1.Plots(1).Name
grapher1.Plots(1).AutoFirstRow = False
'grapher1.Plots(1).FirstRow = 5设置剖面的首个数据
'grapher1.Plots(1).AutoLastRow=FALSE’设置自动最后一行为FALSE
Debug.Print grapher1.Plots(1).FirstRow
n = InStrRev(dataFileName, “.dat”, -1)
str = Left(dataFileName, n - 2)
If sx = True Then
str = str + “_1.dat” '指向颜色文件
Else
str = str + “_2.dat” '指向颜色文件
End If
Open str For Input As #2
Input #2, bh, ys
Set FillFormat = grapher1.Plots(1).Fill
grapher1.Plots(1).line.ForeColor = ys’设置线的颜色
FillFormat.PatternName = “Solid”
'FillFormat.PatternType = grfStockPat
FillFormat.ForeOpacity = 100 '不透明度,这里要设置为100否则颜色会出现问题
FillFormat.ForeColor = ys '添加颜色值
For i = 1 To fdn - 1
If sx = True Then
Set linePlot = grapher1.AddLinePlot(dataFileName, xn, i + yn) '添加剖面
Else
Set linePlot = grapher1.AddLinePlot(dataFileName, xn, i + yn) '添加剖面
End If
Input #2, bh, ys
Set FillFormat = linePlot.Fill
linePlot.line.ForeColor = ys’设置线的颜色
FillFormat.PatternName = “Solid”
'FillFormat.PatternType = grfStockPat
FillFormat.ForeOpacity = 100 '不透明度,这里要设置为100否则颜色会出现问题
FillFormat.ForeColor = ys '添加颜色值
Next i
Close #2
End Sub
添加剖面图
Set GrapherApp = CreateObject(“Grapher.Application”)
GrapherApp.Visible = True‘设置可见
Set Docs = GrapherApp.Documents
Set Plot = Docs.Add(grfPlotDoc)
Set Shapes = Plot.Shapes
Set Grapher = Shapes.AddLinePlotGraph(filepath, x, y)'Returns an AutoGraph object.
设置AutoGraph对象的名称
Grapher.title.Text="1234"
通过AutoGraph对象获取AutoLinePlot对象
Dim LinePlot As Object
Set LinePlot = Grapher.Plots.Item(1) '获取刚刚绘制的AutoLinePlot对象
设置剖面线的属性
Dim LineFormat As Object’保存返回的AutoLine对象
Set LineFormat = LinePlot.Line’返回AutoLine对象
LineFormat.ForeOpacity = 100 '不透明度
LineFormat.Width = 0.1’设置线宽
LineFormat.ForeColor = RGB(255, 0, 0) '设置线颜色为红色,这个好用
LineFormat.Style = “.3 in. Dash” '“Dash Dot Dot”'设置线条样式
设置AutoPlot对象的起始行与结束行
感觉AutoPlot与AutoLinePlot对象是一样的,同样的方式获取
'Creates a graph and assigns it to the
'variable named “LineGraph”
Set LineGraph = Shapes.AddLinePlotGraph(GrapherApp.Path+"\samples\sample3.dat")
'Declare LinePlot as an object
Dim LinePlot As Object
'Set LinePlot to the first line plot on
'the LineGraph graph
Set LinePlot = LineGraph.Plots.Item(1)‘这里跟AutoLinePlot对应的获取一样’
LinePlot .AutoFirstRow=False’首先要设置AutoPlot对象的AutoFirstRow对象为False
LinePlot.FirstRow=4’再设置首行的值
LinePlot.AutoLastRow=False’设置自动尾行为False
LinePlot.LastRow=71’设置到71行结束
设置坐标轴的最大值最小值及位置
'Declares Axes as an object
Dim Axes As Object
'Assigns the AutoAxes collection to the variable named “Axes”
Set Axes = Grapher.Axes
'Declares Axis as an object
Dim Axis As Object
'Assigns the X axis to the variable named “Axis”
Set Axis = Axes(1) 'x轴
Axis.AutoMax = False’先设置自动最大,自动最小为False
Axis.AutoMin = False
Axis.Max = xx_max
Axis.Min = xx_min
Axis.xPos = x_pos
Axis.yPos = y_pos
Axis.length = xx_length
Set Axis = Axes(2) 'y轴


 3510
3510

 被折叠的 条评论
为什么被折叠?
被折叠的 条评论
为什么被折叠?
 到【灌水乐园】发言


