


 文章详细描述了如何使用Python的requests和pandas库从12306网站抓取并处理火车站信息,通过数据处理和可视化工具matplotlib展示车站数量Top10城市,同时解决了中文显示问题。在数据存储过程中,注意到了车站代码可能出现重复,从而调整了数据结构以避免信息丢失。
12306信息可视化
这里写目录标题
url=https://kyfw.12306.cn/otn/resources/js/framework/station_name.js
通过访问网站发现,目标网站校验IP地址,以及协议头是否完全
访问结果部分如下:
@bjb|北京北|VAP|beijingbei|bjb|0|0357|北京|||@bjd|北京东|BOP|beijingdong|bjd|1|0357|北京|||@bji|北京|BJP|beijing|bj|2|0357|北京|||@bjn|北京南|VNP|beijingnan|bjn|3|0357|北京|||@bjx|北京大兴|IPP|beijingdaxing|bjdx|4|0357|北京|||@bjx|北京西|BXP|beijingxi|bjx|5|0357|北京|||@bjy|北京朝阳|IFP|beijingchaoyang|bjcy|6|0357|北京|||@cqb|重庆北|CUW|chongqingbei|cqb|7|1717|重庆|
发现数据
根据比对发现,发现数据格式存储为:
@bjb|北京北|VAP|beijingbei|bjb|0|0357|北京|
总结格式为:
@+车站代码+车站名称+...+拼音+...+...+所属城市
代码实现
数据处理
- 通过
requests包进行网页访问
import requests

url = 'https://kyfw.12306.cn/otn/resources/js/framework/station_name.js'
data = requests.get(url).text
if not data:
    print('获取数据失败')
print(data)
- 通过获取数据后,将数据分割为分类数据
station_data = data.split('=')[-1]
station_name = station_data.strip("='@")
station_name = station_name.rstrip("';")
station_arr = station_name.split('@')
if not station_arr:
    print('获取数据失败')
station_dict = {}
print(station_arr)
- 将数据分类完成后,取出需要数据进行归类,并且使用pd库存放到Excel中
import pandas as pd

for station in station_arr:
    info = station.split('|')
    station_code = info[0]
    station_name = info[1]
    station_city = info[7]
    station_dict[station_code] = {
        'Station Name': station_name,
        'station_City': station_city
    }

df = pd.DataFrame.from_dict(station_dict, orient='index').reset_index()

df.columns = ['Station Code', 'Station Name', 'station_City']

print(df)
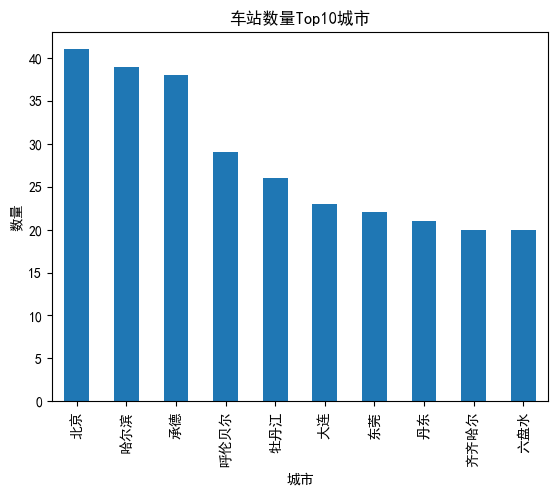
数据可视化
- 将数据进行可视化,使用bar图进行展示
import matplotlib.pyplot as plt

city_count = df['station_City'].value_counts().nlargest(10)
city_count.plot(kind='bar')
plt.xlabel('城市')
plt.ylabel('数量')
plt.title('车站数量Top10城市')
plt.show()
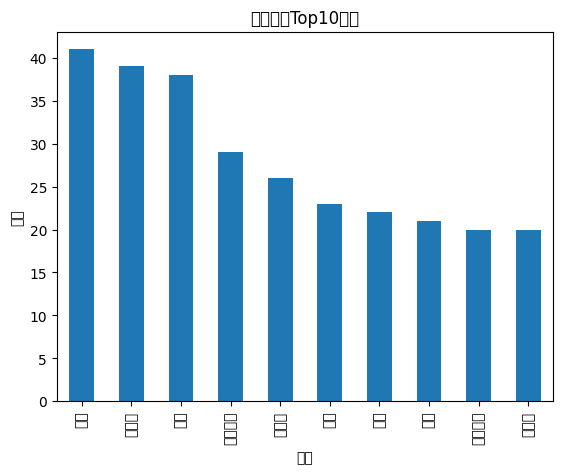
5. 发现plt打印不了中文,通过查看代码,认为是字体问题或者编码问题
city_count = df['station_City'].value_counts().nlargest(10)
city_count.plot(kind='bar')
plt.rcParams['font.sans-serif'] = ['SimHei']
plt.xlabel('城市')
plt.ylabel('数量')
plt.title('车站数量Top10城市')
plt.show()
6. 运行之后发现与原始数据不一致, 通过对于前面代码进行审查
可能原因:
-
requests时候数据没有获取全 -
分割数据时候分割错误
-
存储数据时候格式有问题
-
逐步进行调试, 逐步检查变量值
在下面代码部分变量存储时候发现问题
for station in station_arr:
    info = station.split('|')
    station_code = info[0]
    station_name = info[1]
    station_city = info[7]
    station_dict[station_code] = {
        'Station Name': station_name,
        'station_City': station_city
    }
上述代码中, station_dict作为字典进行存储时候, 时候station作为键, 根据以往经验认为key_code应该是唯一的,但是在此网站中,存在重复的代码, 字典存入数据时候会造成值的覆盖, 导致失去部分值
- 修改代码,将字典键进行更改,使用车站名作为key_code
for station in station_arr:
    info = station.split('|')
    station_code = info[0]
    station_name = info[1]
    station_city_code=info[6]
    station_city = info[7]

    station_dict[station_name] = {
        'Station_code': station_code,
        'station_City': station_city,
        'station_city_code':station_city_code,
    }
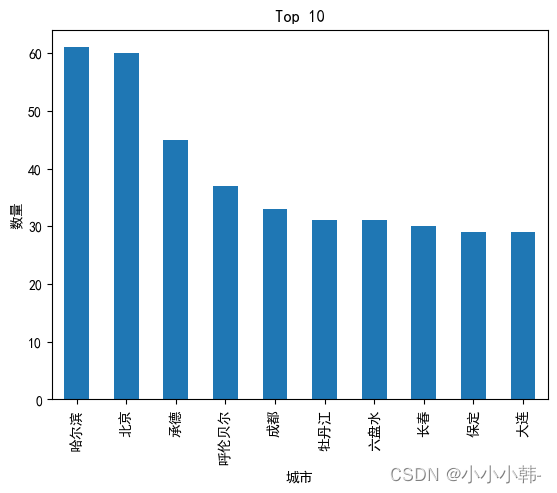
- 再次运行全部代码, 得到正确结果
import requests
import pandas as pd
import matplotlib.pyplot as plt

def get_station_code():
    url = 'https://kyfw.12306.cn/otn/resources/js/framework/station_name.js'
    requests.packages.urllib3.disable_warnings()
    headers = {
        'User-Agent': 'Mozilla/5.0 (Windows NT 10.0; Win64; x64)'
        ' AppleWebKit/537.36 (KHTML, like Gecko) Chrome/80.0.3987.149 Safari/537.36'
    }
    data = requests.get(url).text
    if not data:
        print('获取数据失败')
        return None
    # @bjb|北京北|VAP|beijingbei|bjb|0|0357|北京|
    station_data = data.split('=')[-1]
    station_name = station_data.strip("='@")
    station_name = station_name.rstrip("';")
    station_arr = station_name.split('@')

    station_dict = {}

    for station in station_arr:
        info = station.split('|')
        station_code = info[0]
        station_name = info[1]
        station_city_code=info[6]
        station_city = info[7]

        station_dict[station_name] = {
            'Station_code': station_code,
            'station_City': station_city,
            'station_city_code':station_city_code,
        }

    df = pd.DataFrame.from_dict(station_dict, orient='index').reset_index()
    df.columns = ['Station Name','Station Code', 'Station City','Station City Code']

    city_count = df['Station City'].value_counts().nlargest(10)
    city_count.plot(kind='bar')
    plt.rcParams['font.sans-serif'] = ['SimHei']
    plt.xlabel('城市')
    plt.ylabel('数量')
    plt.title('Top 10')
    plt.show()

    df.to_excel("station_code.xlsx", index=False)

get_station_code()


 1924
1924

 被折叠的 条评论
为什么被折叠?
被折叠的 条评论
为什么被折叠?
 到【灌水乐园】发言


