


1) 处理需要同时动态修改:时间间隔+时间范围 的折线图
设置参数:
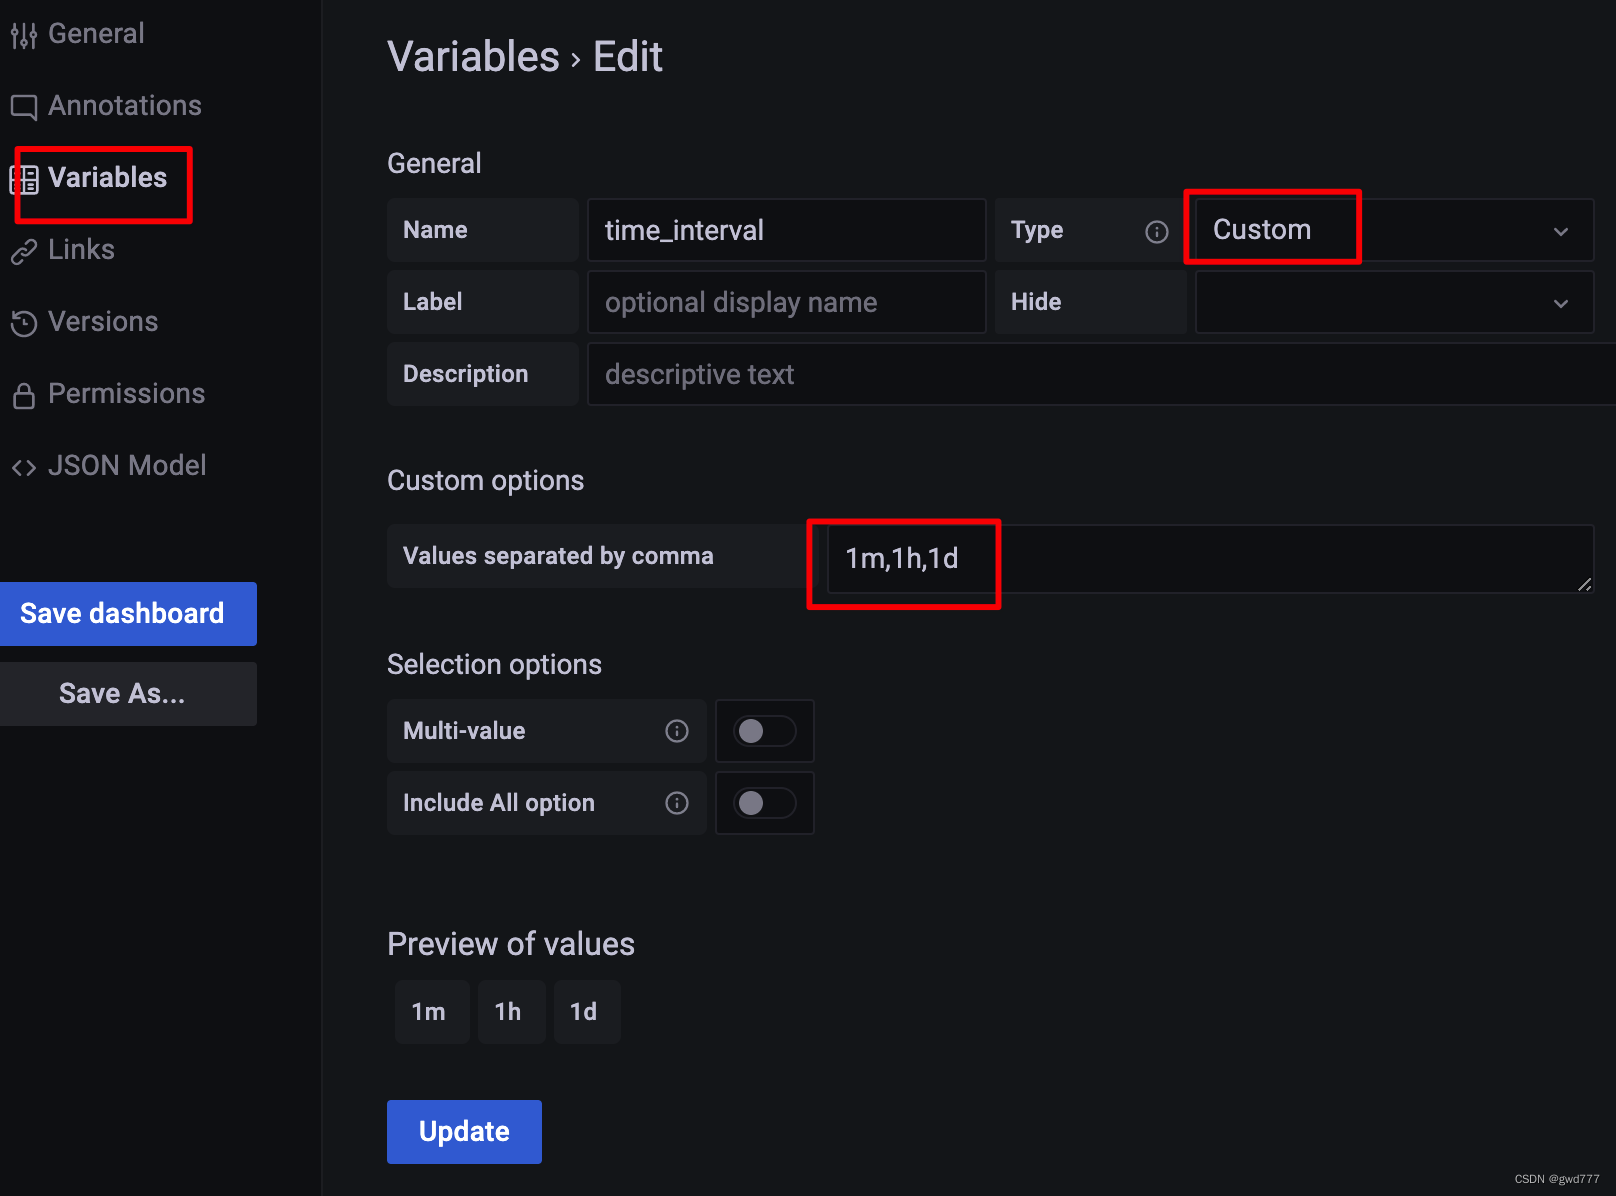
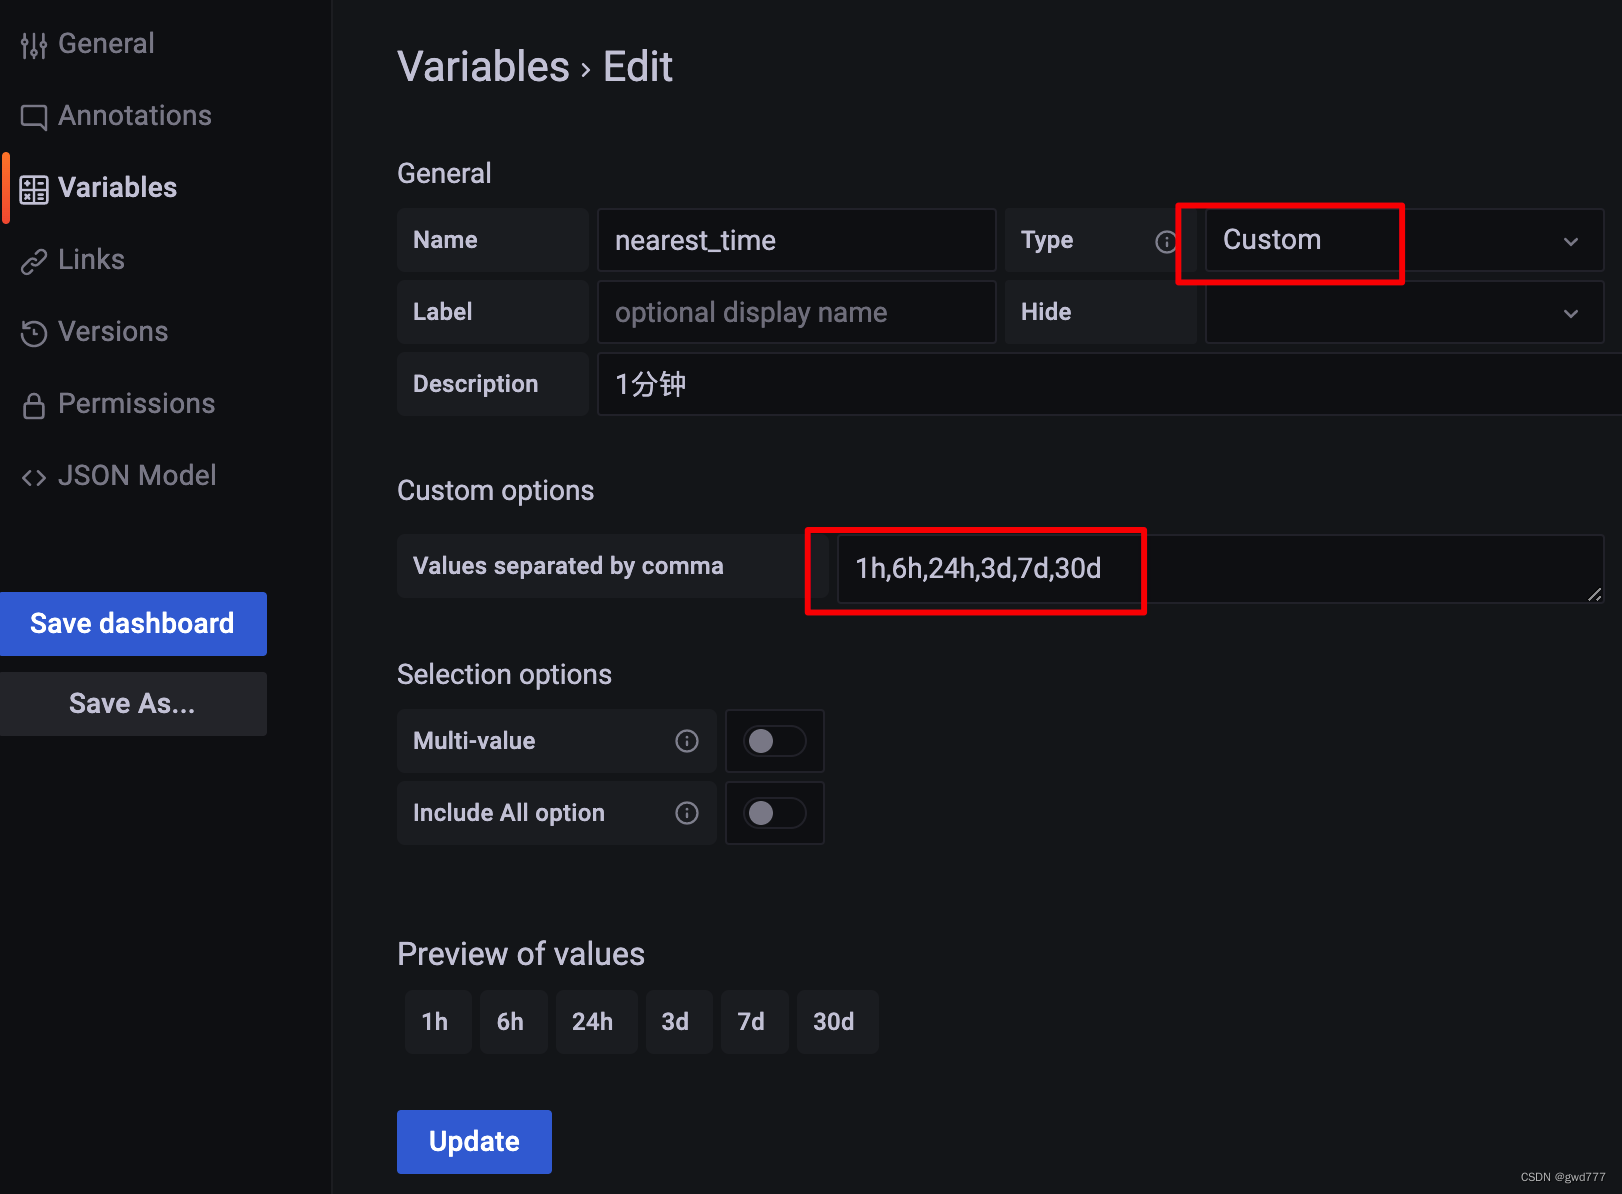
sql 脚本里面接受参数 ${ your_paramers }
with Param as(
	select
		multiIf(
			'${nearest_time}'='1h', 3600*1,
			'${nearest_time}'='6h', 3600*6,
 			'${nearest_time}'='24h',3600*24,
 			'${nearest_time}'='3d', 3600*24*3,
 			'${nearest_time}'='7d', 3600*24*7,
 			'${nearest_time}'='30d', 3600*24*30,
 			3600
 		) as nearest_time
),F as(
	select
		log_contract_address,
		entry_contract_address,
		maxMerge(last_use_time) as xtime,
		minMerge(first_use_time) as mtime
	from xxxdb.xxx_view
	where log_contract_address='${contract_address}'
	group by log_contract_address,entry_contract_address
),Rt as(
	select
		log_contract_address,
		mtime,
		multiIf(
			'${time_interval}'='1m', toDateTime(formatDateTime(mtime, '%Y-%m-%d %H:%M:00')),
			'${time_interval}'='1h', toDateTime(formatDateTime(mtime, '%Y-%m-%d %H:00:00')),
 			'${time_interval}'='1d', toDateTime(formatDateTime(mtime, '%Y-%m-%d 00:00:00')),
 			toDateTime(formatDateTime(mtime, '%Y-%m-%d %H:%M:00'))
 		) as gptime
 	from F where mtime >= toDateTime(now())-(select nearest_time from Param)
)
select
	gptime,
	count(1) as cnt
from Rt group by log_contract_address,gptime
2) 如何在 SQL生产的表当中,动态的改变参数的显示
with Param as(
	select
		multiIf(
			'${nearest_time}'='1h', 3600*1,
			'${nearest_time}'='6h', 3600*6,
 			'${nearest_time}'='24h',3600*24,
 			'${nearest_time}'='3d', 3600*24*3,
 			'${nearest_time}'='7d', 3600*24*7,
 			'${nearest_time}'='30d', 3600*24*30,
 			3600
 		) as nearest_time,
 		multiIf(
			'${nearest_time}'='1h', '最近1小时',
			'${nearest_time}'='6h', '最近6小时',
 			'${nearest_time}'='24h','最近24小时',
 			'${nearest_time}'='3d', '最近3天',
 			'${nearest_time}'='7d', '最近7天',
 			'${nearest_time}'='30d','最近30天',
 			'最近1小时'
 		) as title
),F as(
	select
		to_address,
		from_address,
		minMerge(first_call_time) as mtime,
		maxMerge(last_call_time) as xtime
	from xxxdb.xxx_view
	where to_address='${contract_address}'
	group by to_address,from_address
),F2 as(
	select
		to_address,
		(select title from Param) as title,
		case when mtime >= toDateTime(now())-(select nearest_time from Param) then 1 else 0 end as add_flag,
		case when xtime >= toDateTime(now())-(select nearest_time from Param) then 1 else 0 end as active_flag
	from F
)
select
	max(title) as title,
	sum(add_flag) as "新增用户数",
	sum(active_flag) as "活跃用户数"
from F2 group by to_address
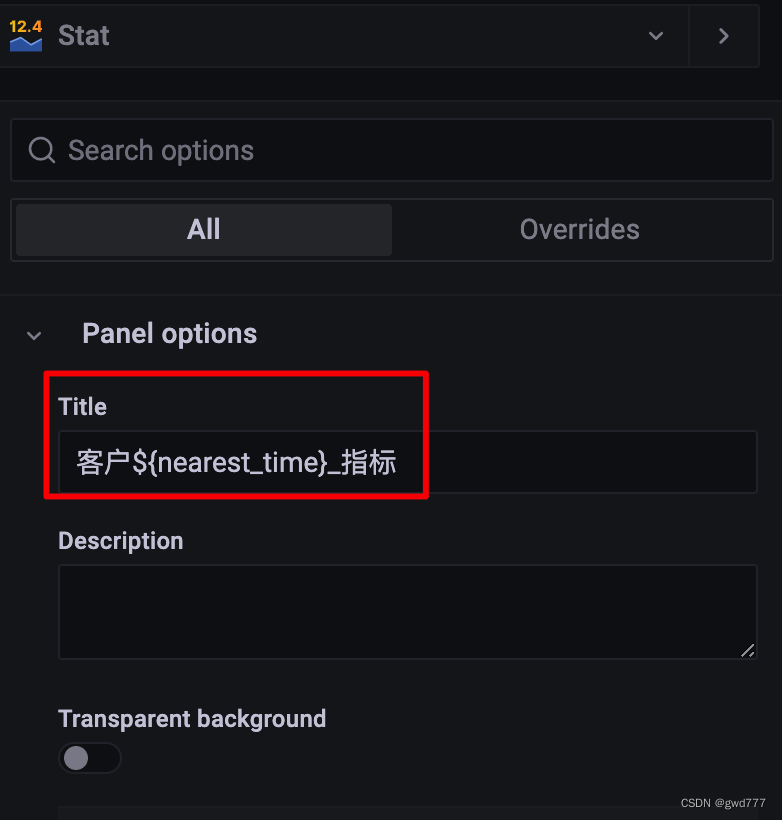
3)在图表的标题上也可以动态显示参数
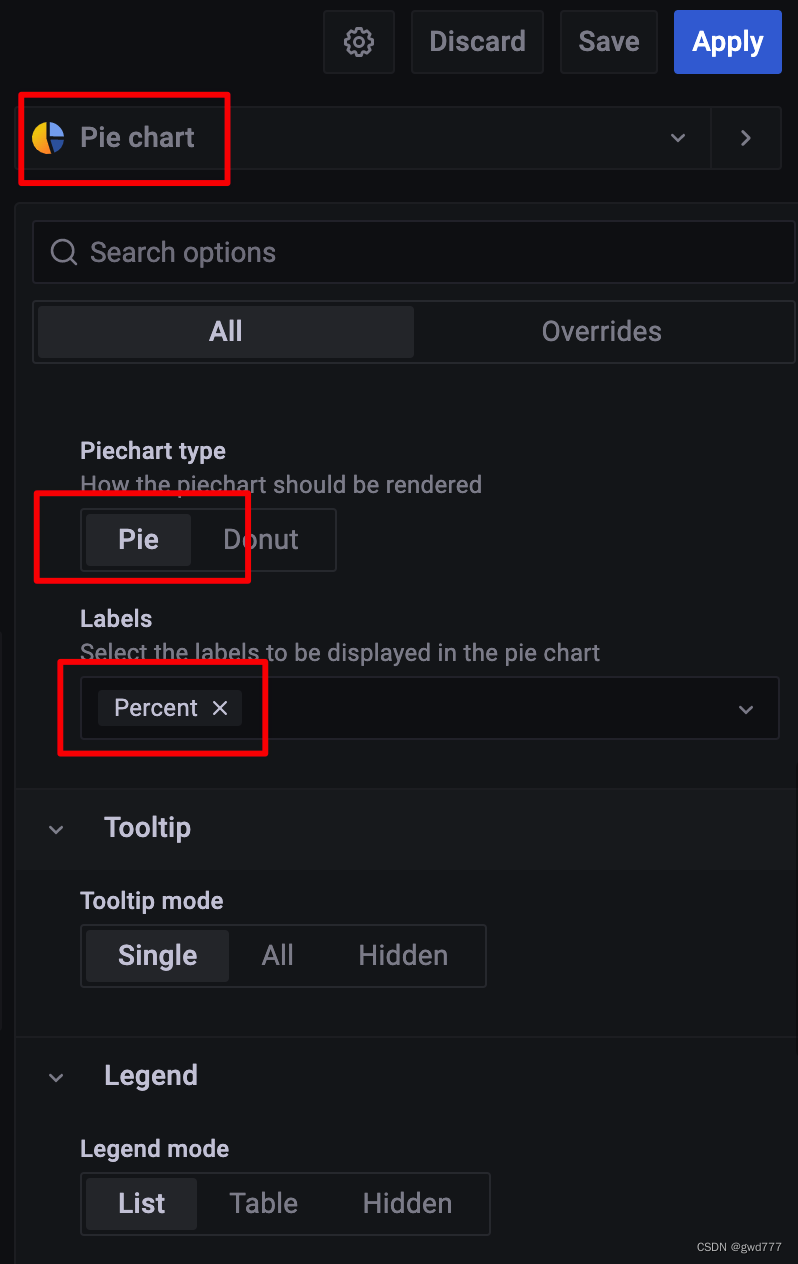
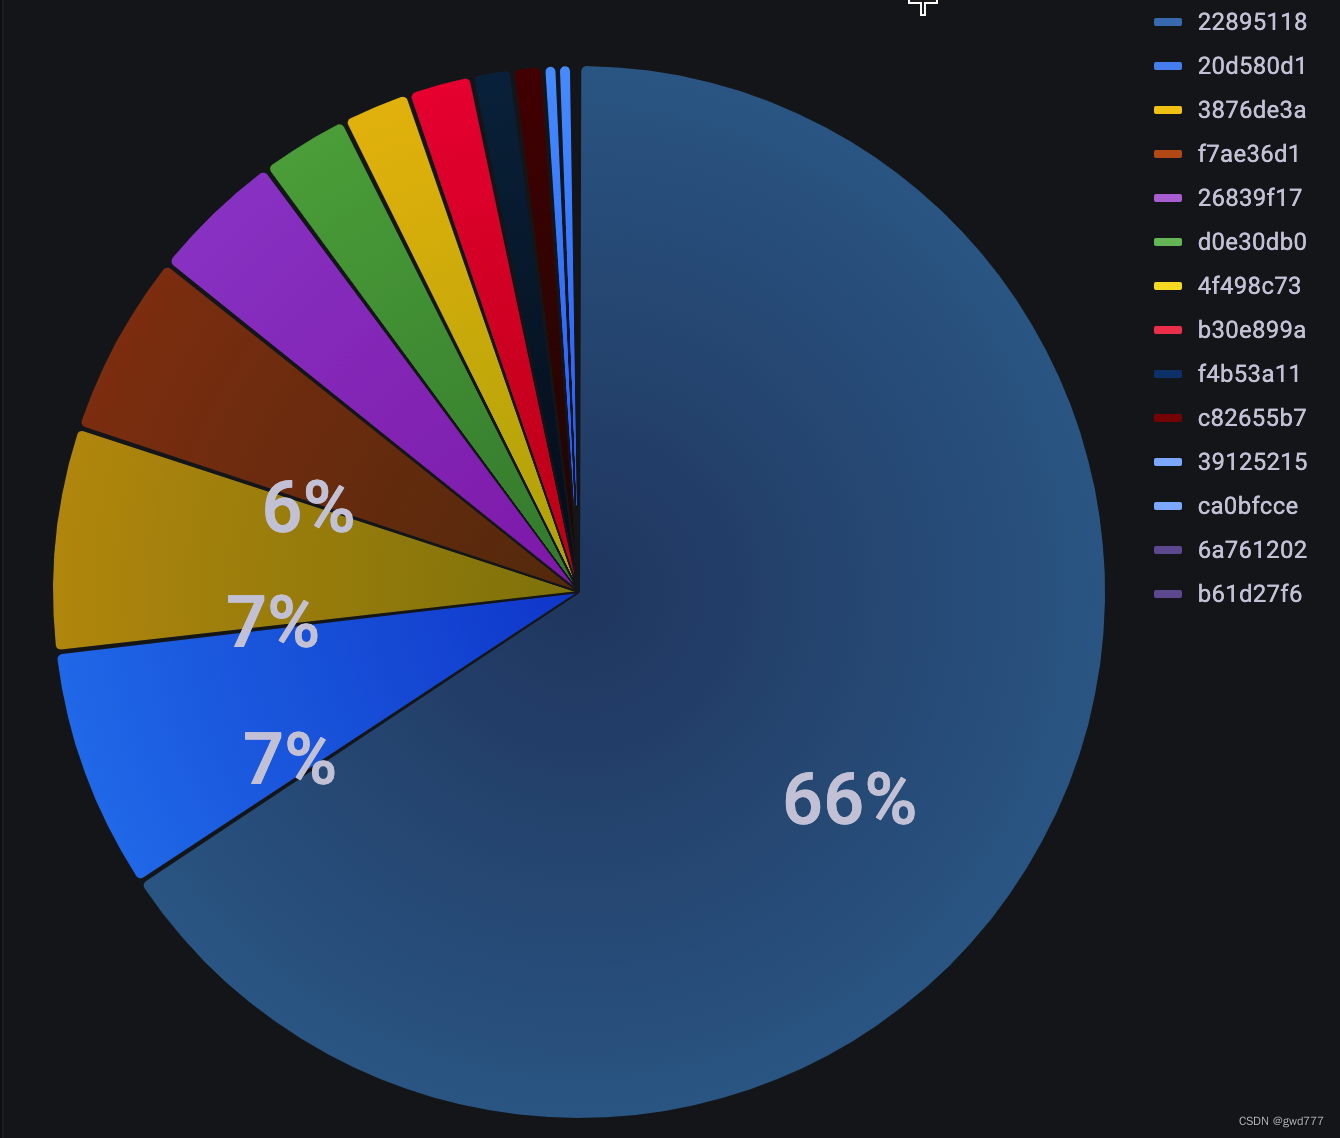
4)如何设置饼状图
with Param as(
	select
		multiIf(
			'${nearest_time}'='1h', 3600*1,
			'${nearest_time}'='6h', 3600*6,
 			'${nearest_time}'='24h',3600*24,
 			'${nearest_time}'='3d', 3600*24*3,
 			'${nearest_time}'='7d', 3600*24*7,
 			'${nearest_time}'='30d', 3600*24*30,3600) as nearest_time
),F as(
	select
		log_address,
		tx_to,
		tx_hash,
		tx_method,
		topic0,
		block_time
	from xxxdb.xxx_log
	where block_time >= toDateTime(now())-(select nearest_time from Param)
	and log_address = '${contract_address}'
),Et as(
	select count(1) as event_cnt from F
),Md as (
	select
	  tx_method,
		count(1) as mdcnt
	from F,Et et group by log_address,tx_method
)
select * from Md
5)通过打行标记的方式,确定分组依据
with F as(
	select
			tx_hash,
			data_dcm,
			address,
			case
					when from_addr = lower('${contract_address}') then 'out'
					when to_addr = lower('${contract_address}') then 'in'
			else 'no' end as direction,
			multiIf(
				'${time_interval}'='1m', toDateTime(formatDateTime(timestamp, '%Y-%m-%d %H:%M:00')),
				'${time_interval}'='1h', toDateTime(formatDateTime(timestamp, '%Y-%m-%d %H:00:00')),
	 			'${time_interval}'='1d', toDateTime(formatDateTime(timestamp, '%Y-%m-%d 00:00:00')),
	 			toDateTime(formatDateTime(timestamp, '%Y-%m-%d %H:%M:00'))
	 		) as gptime
	from etherdata.dwd_com_eth_evt_transfer_di where
	(from_addr=lower('${contract_address}') or to_addr=lower('${contract_address}'))
	and action = 'transfer'
	and data_dcm != -1
	and $__timeFilter(timestamp)
),MNO as(
	select
		address,
		cnt,
		ROW_NUMBER() over(partition by direction order by cnt desc) as rk
	from(
		SELECT address,max(direction) as direction, count(1) as cnt
		FROM F group by address
	)f
)
select
	address,
	toUInt64(sum(data_dcm)) as "转出_原始金额",
	gptime
from F f left join MNO mno on f.address=mno.address
where direction ='out' and mno.rk=1
group by address,gptime
order by gptime desc
4)通过一个SQL画出N条折线(一条折线代表一个类别)的设置
select
toStartOfInterval(toDateTime(timestamp), INTERVAL 3600 second) as gptime,
action AS class ,
count() as cnt
from etherdata.dwd_com_eth_evt_transfer_di where `timestamp` > '2022-11-20'
and address not in (
select address
from etherdata.dwd_com_eth_evt_transfer_di
where `timestamp` > '2022-11-20'
group by address order by count() desc limit 10
)
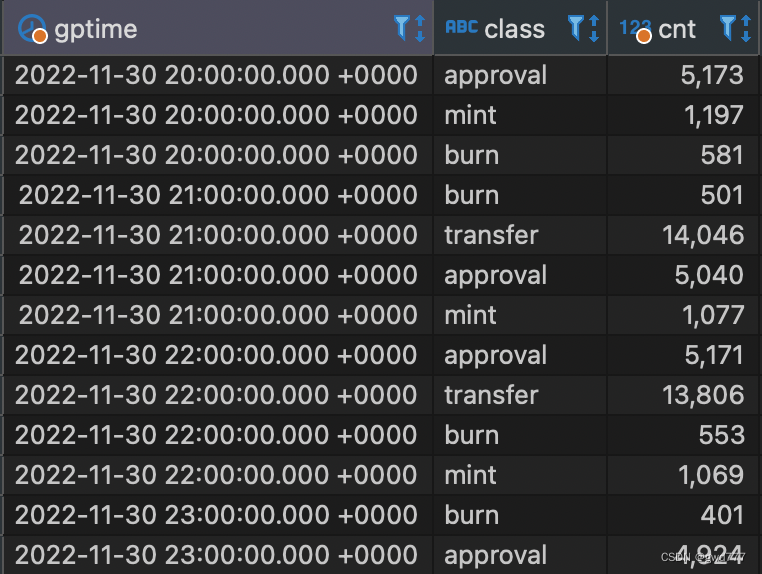
group by class,gptime order by gptime数据底表如图所示,gptime是增序的时间序列;address可以看做是类别,而cnt可以看做是每个类别在不同时间采样点上的采样值;由此底表可以利用grafana设置如下时间序列折线图。
(数据底表展示,时间/类别/数值,一同3列)
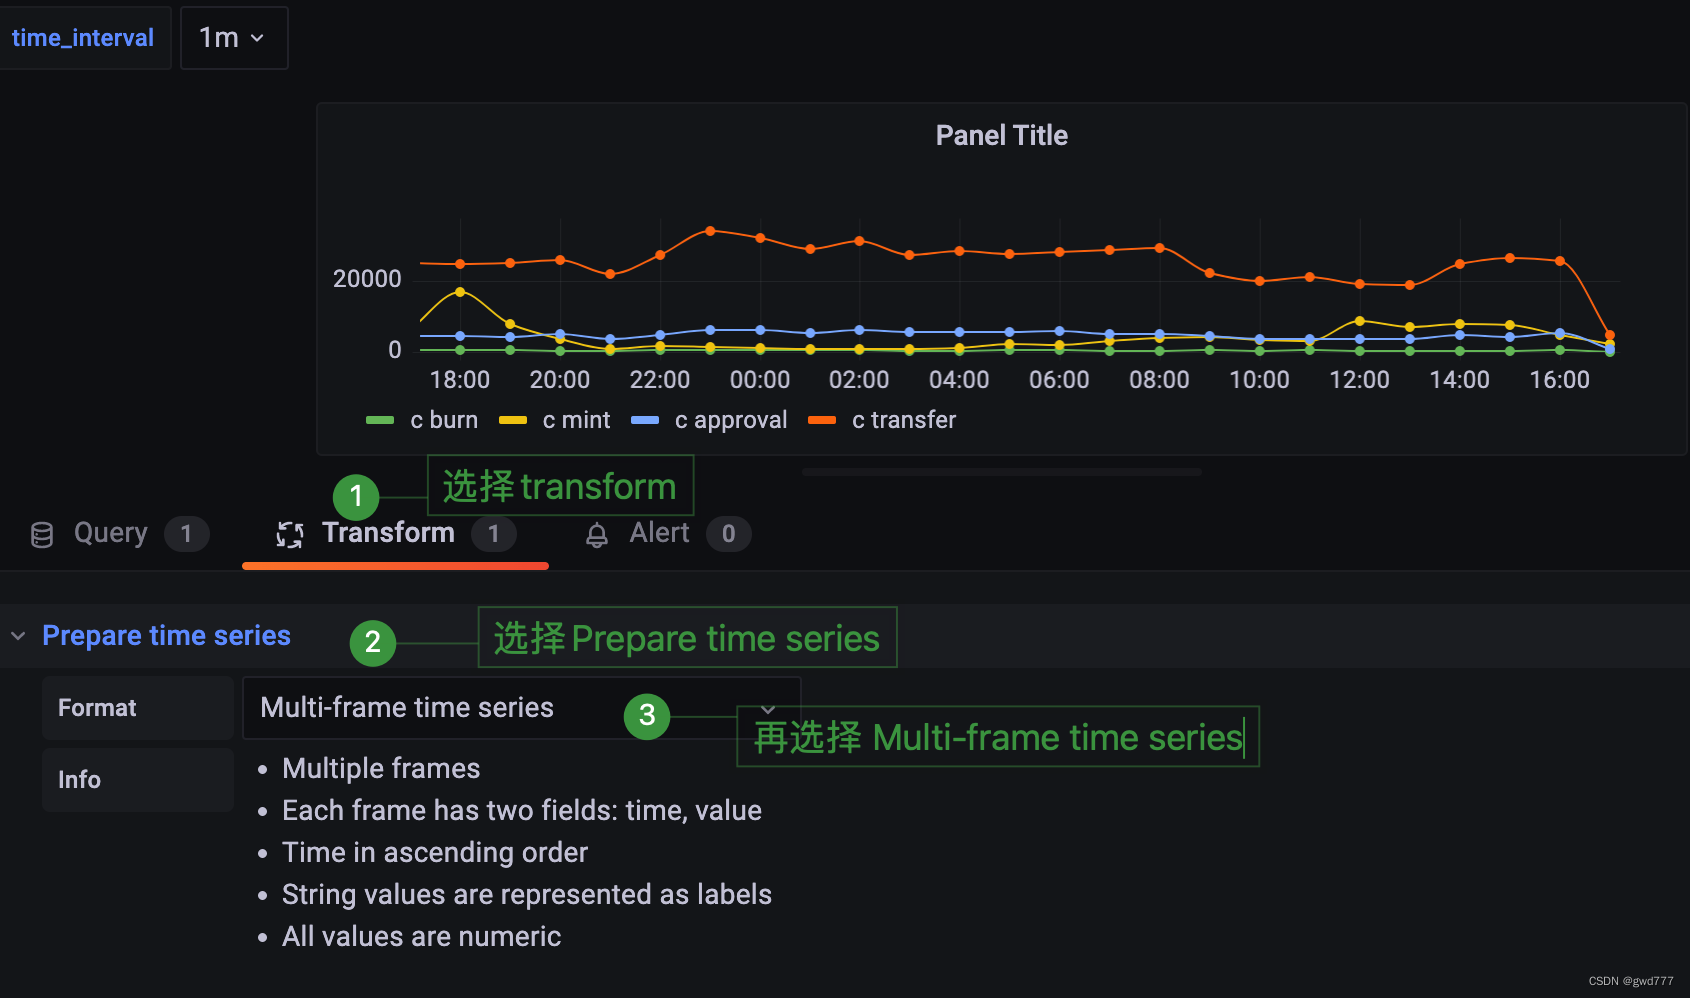
(grafana当中的设置,如图所示 1,2,3)
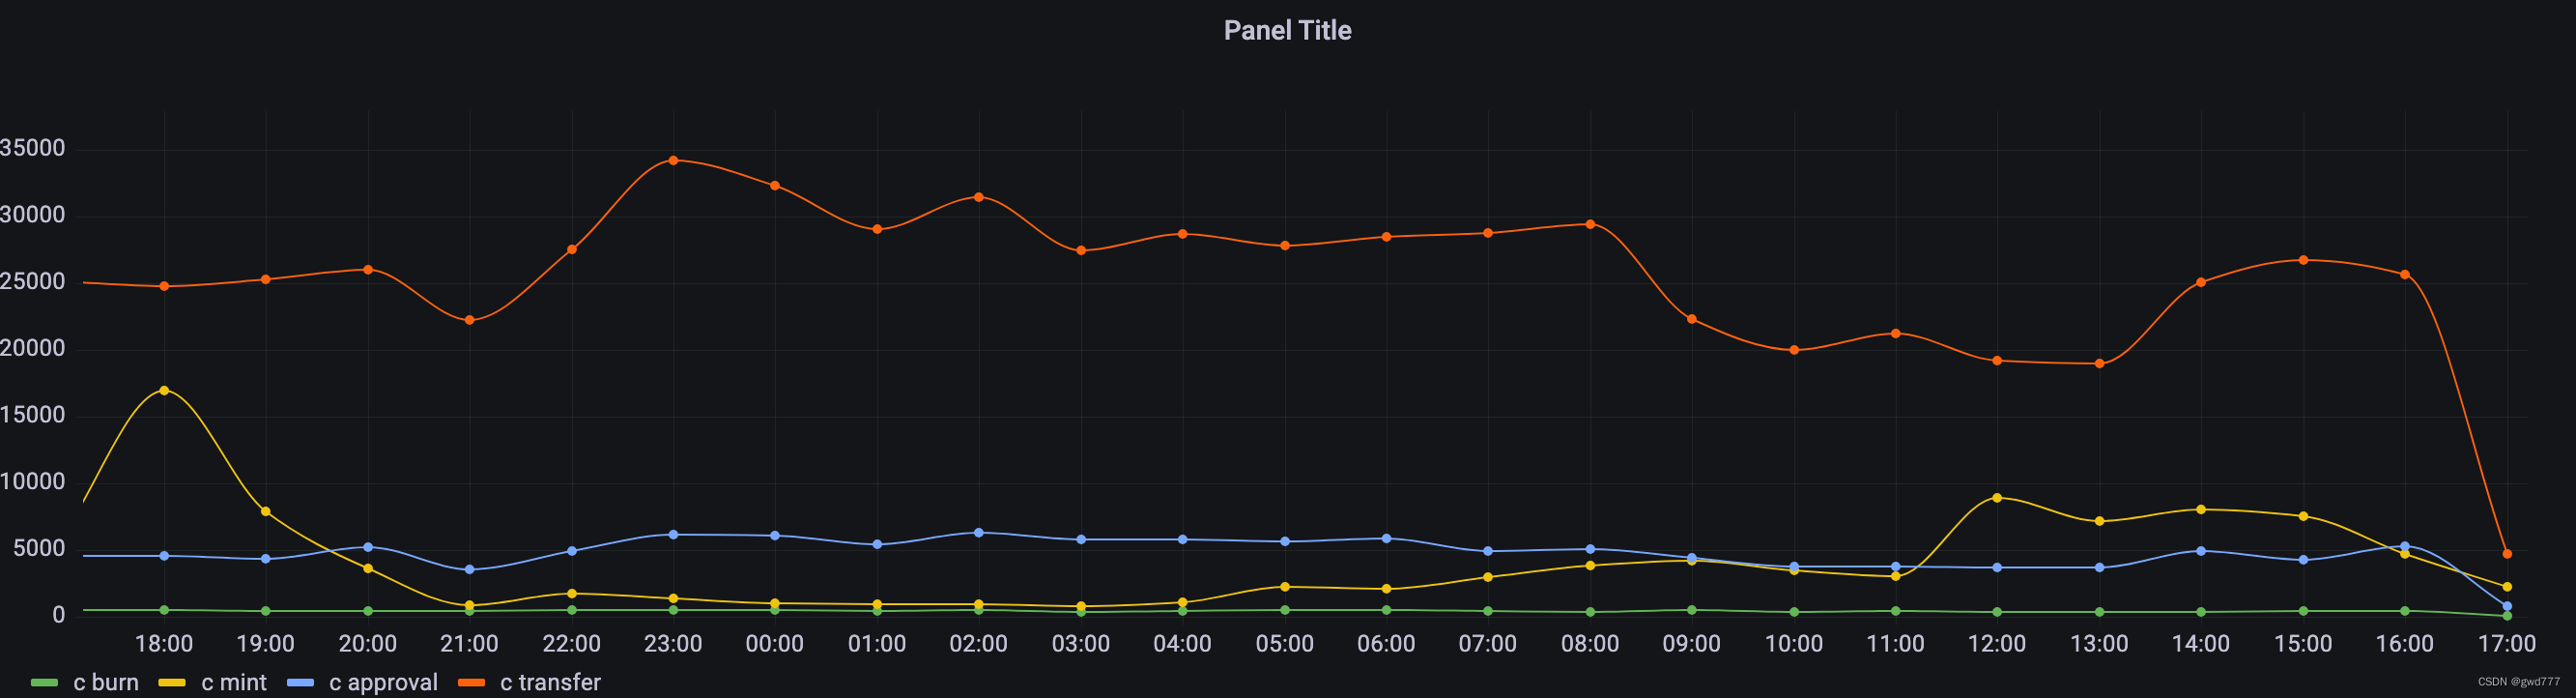
(设置完成后显示的效果,与多个sql落在一起展示的效果相同,而且节省了查询的次数)


 5724
5724

 被折叠的 条评论
为什么被折叠?
被折叠的 条评论
为什么被折叠?
 到【灌水乐园】发言


