


 本文展示了如何利用Echarts库制作pictorialBar图,通过详细代码指导实现图表的创建,并提供了Echarts的官方API链接以供参考。
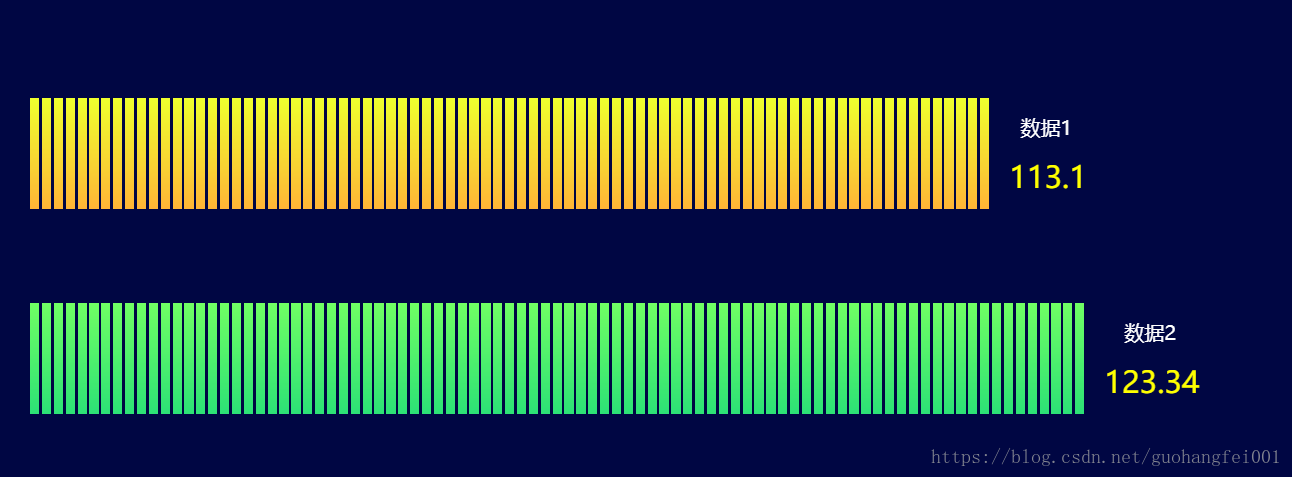
1.最终结果
2.Echart API 地址:http://echarts.baidu.com/option.html
3.代码:
引入图片:


<!DOCTYPE html>
<html lang="en">
<head>
    <meta charset="utf-8">
    <meta http-equiv="X-UA-Compatible" content="IE=edge">
    <meta name="viewport" content="width=device-width, initial-scale=1.0">
    <meta name="description" content="ECharts">
    <meta name="author" content="kener.linfeng@gmail.com">
    <title>ECharts · Example</title>

    <script src="./echarts.js"></script>

</head>

<body>
    <div id="chart" class="chart" style="height: 530px;"></div>

	<script type="text/javascript">
	// 基于准备好的dom,初始化echarts图表
	var myChart = echarts.init(document.getElementById('chart'));

	option = {
	backgroundColor: '#000643',
    title: {
        text: ''
    },
	//间距
    grid: {
        containLabel: true,
        left: 30
    },
    yAxis: {
        data: ['数据1', '数据2'],
        inverse: true,
        axisLine: {show: false},
        axisTick: {show: false},
        axisLabel: {
			show: false,
            margin: 30,
            textStyle: {
                fontSize: 14
            }
        },
        axisPointer: {
            label: {
                show: true,
                margin: 30
            }
        }
    },
    xAxis: {
        splitLine: {show: false},
        axisLabel: {show: false},
        axisTick: {show: false},
        axisLine: {show: false}
    },
    series: [{
        type: 'pictorialBar',
        label: {
			normal: {
        	show: true,
        	position: 'right',
        	offset: [15, 0],
			formatter:function(params){
				console.log(params)
                return '{white|' + params.name+'} \n \n \n{yellow|' + params.data.value+'}';
            },
			//富文本模板 对应return中内容
			rich: {
            	white: {
                	color: 'white',
					fontSize: 20,
					align:'center'
            	},
				yellow: {
                	color: 'yellow',
					fontSize: 30,
					align:'center'
            	}
        }

        }
	},
        symbolRepeat: true,
		//图片长宽比
        symbolSize: ['5%', '60%'],
        barCategoryGap: '10%',
        data: [{
            value: 113.1,
            symbol: 'image://./黄色.png',
        }, {
            value: 123.34,
            symbol: 'image://./绿色.png',
        }]
    }]
};

	// 为echarts对象加载数据
	myChart.setOption(option);

</script>
</body>
</html>


 3万+
3万+

 被折叠的 条评论
为什么被折叠?
被折叠的 条评论
为什么被折叠?
 到【灌水乐园】发言


