


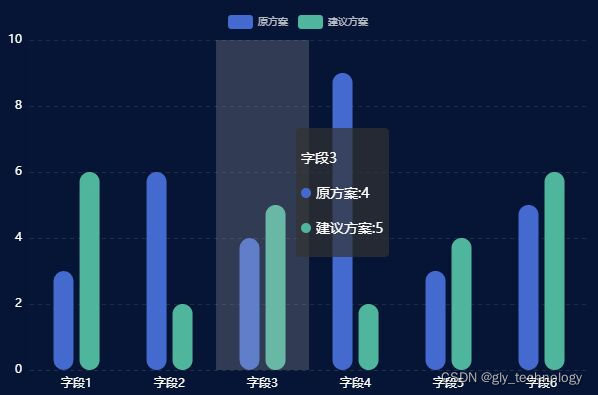
 本文介绍如何使用ECharts创建一个具有定制样式和交互功能的柱状图。该图表对比了两种方案的数据,并通过轴线样式、图例、提示框等功能增强了可视化效果。
<!DOCTYPE html>
<html>
<head>
<meta charset="utf-8" />
<title>Echarts图表</title>
<!-- 引入echarts.min.js -->
<script src="https://cdn.staticfile.org/echarts/4.3.0/echarts.min.js"></script>
</head>
<body>
<div id="main" style="width: 600px;height:400px;"></div>
<script type="text/javascript">
var myChart = echarts.init(document.getElementById('main'));
var option = {
color: ['#446acf', '#4fb59d'],
backgroundColor: '#061436',
// 图例
legend: {
top: 10,
textStyle: {
fontSize: 10,
color: 'rgba(255,255,255,.7)'
},
data: ['原方案', '建议方案']
},
// 表格位置
grid: {
left: 10,
right: 10,
top: 40,
bottom: 10,
containLabel: true
},
// 提示框
tooltip: {
trigger: 'axis',
axisPointer: {
type: 'shadow',
},
showContent: true,
formatter: function(params) {
var res = '<div><p>' + params[0].name + '</p></div>'
for (var i = 0; i < params.length; i++) {
res += '<p>' + params[i].marker + params[i].seriesName + ':' + params[i].value + '</p>'
}
return res;
}
},
xAxis: [{
type: 'category',
axisLine: {
lineStyle: {
// 类型:虚线
type: 'dashed',
color: 'rgba(255,255,255,.01)'
}
},
splitLine: {
lineStyle: {
color: 'rgba(255,255,255,.01)'
}
},
axisLabel: {
color: "rgba(255,255,255,1)"
},
data: ['字段1', '字段2', '字段3', '字段4', '字段5', '字段6']
}],
yAxis: [{
type: 'value',
name: '',
min: 0,
max: 10,
interval: 2,
axisLine: {
lineStyle: {
color: 'rgba(255,255,255,.01)'
}
},
splitLine: {
lineStyle: {
type: 'dashed',
color: 'rgba(255,255,255,.1)'
}
},
axisLabel: {
color: "rgba(255,255,255,1)"
}
}],
series: [{
name: '原方案',
// 类型:柱形图
type: 'bar',
// 柱子的宽度
barWidth: 20,
data: [3, 6, 4, 9, 3, 5],
itemStyle: {
emphasis: {
barBorderRadius: 30
},
normal: {
barBorderRadius: [10, 10, 10, 10]
}
}
},
{
name: '建议方案',
type: 'bar',
barWidth: 20,
data: [6, 2, 5, 2, 4, 6],
itemStyle: {
emphasis: {
barBorderRadius: 30
},
normal: {
barBorderRadius: [10, 10, 10, 10]
}
}
}
]
};
myChart.setOption(option);
</script>
</body>
</html>


 2488
2488

 被折叠的 条评论
为什么被折叠?
被折叠的 条评论
为什么被折叠?
 到【灌水乐园】发言


