前端3D词云

安装TagCloud库

npm i TagCloud -S

初始化

    const container = '.tagcloud';
    const options = {
      useContainerInlineStyles: false,
      radius: 200,
      keep: true,
      // 词云动画速度模式 slow, normal, fast
      maxSpeed: 'normal',
      initSpeed: 'slow',
    };
    texts = ['txt1', 'txt2']
    tagCloud = TagCloud(container, texts, options);
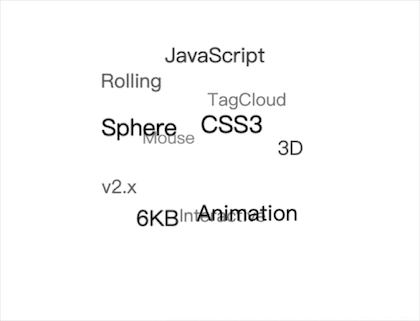
img

修改文字颜色和大小

function RandomNumBoth(Min: number, Max: number) {
  var Range = Max - Min;
  var Rand = Math.random();
  var num = Min + Math.round(Rand * Range); //四舍五入
  return num;
}

const items: any = document.getElementsByClassName('tagcloud--item')
for (const item of items) {
  item.style.color = ['#20ACC4', '#E79C28'][RandomNumBoth(0, 1)]
  item.style.fontSize = ['12px', '16px', '20px', '28px'][RandomNumBoth(0, 1)]
}

img

给文字添加点击事件

    let rootEl: any = document.querySelector('.tagcloud');
    rootEl.addEventListener('click', function clickEventHandler(e: any) {
      if (e.target.className === `tagcloud--item ${style.tagcloud_item}`) {
        onChange?.({keyword: e.target.innerText})
      }
    });

当鼠标移上去时候暂停滚动,鼠标移除时候重新开始滚动

  rootEl.addEventListener('mouseover', function clickEventHandler(e: any) {
    if (e.target.className === `tagcloud--item ${style.tagcloud_item}`) {
      tagCloud.pause()
    }
  });
  rootEl.addEventListener('mouseout', function clickEventHandler(e: any) {
    if (e.target.className === `tagcloud--item ${style.tagcloud_item}`) {
      tagCloud.resume()
    }
  });

img

### 使用 Pyecharts 绘制 3D 图的方法 Pyecharts 是一个功能强大的 Python 数据可视化库,支持多种图表类型,包括传统的 2D 图。然而,Pyecharts 并未直接提供绘制 3D 图的功能[^1]。若要实现 3D 图的绘制,可以结合其他工具或扩展 Pyecharts 的功能来完成。 以下是一个可能的解决方案,通过使用 Pyecharts 的 `Grid3D` 或其他三维绘图组件,结合自定义逻辑来模拟 3D 效果: ```python from pyecharts import options as opts from pyecharts.charts import Scatter3D from pyecharts.faker import Faker # 示例数据 data = [ ["关键1", 50, "红色"], ["关键2", 30, "蓝色"], ["关键3", 40, "绿色"], ["关键4", 20, "黄色"], ["关键5", 60, "紫色"], ] # 将数据转换为适合 Scatter3D 的格式 scatter_data = [ [item[1] * 0.1, item[1] * 0.1, i * 10, item[2]] for i, item in enumerate(data) ] # 创建 3D 散点图 scatter3d = ( Scatter3D() .add( series_name="3D ", data=scatter_data, symbol_size=20, label_opts=opts.LabelOpts(is_show=False), ) .set_global_opts( title_opts=opts.TitleOpts(title="3D 图"), visualmap_opts=opts.VisualMapOpts( max_=80, min_=10, dimension=0, range_color=["red", "blue", "green", "yellow", "purple"] ), ) ) # 渲染图表到 HTML 文件 scatter3d.render("3d_wordcloud.html") ``` #### 解释: - 上述代码中,使用了 `Scatter3D` 来模拟 3D 图的效果。每个关键的频率被映射到散点图的坐标轴上,同时通过颜色和大小进一步区分不同关键的重要性。 - `visualmap_opts` 参数用于设置视觉映射,使得频较高的汇以更大的尺寸和更醒目的颜色显示[^4]。 #### 注意事项: - Pyecharts 的核心功能并不包含原生的 3D 支持,因此需要借助其他方法(如上述示例中的散点图)来间接实现。 - 如果需要更复杂的 3D 效果,可以考虑结合其他库(如 `matplotlib` 或 `plotly`),这些库提供了更丰富的 3D 可视化功能[^2]。
评论 1
添加红包

请填写红包祝福语或标题

红包个数最小为10个

红包金额最低5元

当前余额3.43前往充值 >
需支付:10.00
成就一亿技术人!
领取后你会自动成为博主和红包主的粉丝 规则
hope_wisdom
发出的红包
实付
使用余额支付
点击重新获取
扫码支付
钱包余额 0

抵扣说明:

1.余额是钱包充值的虚拟货币,按照1:1的比例进行支付金额的抵扣。
2.余额无法直接购买下载,可以购买VIP、付费专栏及课程。

余额充值