


 本文介绍了如何配置Hystrix与Turbine、Dashboard进行实时监控,包括启动类配置、配置文件设置,并强调了Turbine中cluster-name-expression配置的特殊性。通过整合,实现对分布式服务的高效监控和可视化展示。
hystrix可以通过和turbine、dashboard的配合实现实时监控,其中turbine用于聚合服务的数据,dashboard接入turbine的数据,将其展示出来,这三者的结合使得我们可以做到实时监控。
1, turbine的使用
1.1, 配置启动类
turbine服务的启动类相比其他服务的启动类主要是多了一个@EnableTurbine。
@EnableDiscoveryClient
//@SpringBootApplication
@EnableHystrix
@EnableTurbine
@EnableAutoConfiguration
1.2, 配置文件
部分配置如下:
turbine:
  #指定了所需要监控的服务名(application.yml中的服务名称,不是maven的项目名字)
  app-config: hystrix-consumer
  #有多个集群的情况下,每个turbine监控一个集群
  cluster-name-expression: "'default'"
  #默认情况下,turbine是以host区分聚合服务的。
  #如果是在本地聚合服务,则还要通过port区分服务并收集数据
  combine-host-port: true
  instanceUrlSuffix:
    default: actuator/hystrix.stream
  aggregator:
    clusterConfig: default
2,dashboard的使用
dashboard服务的启动类的配置
@EnableHystrixDashboard
@SpringCloudApplication
注意,单个hystrix服务和聚合多个服务后的turbine服务开放的端口是不一样的,如下所示:
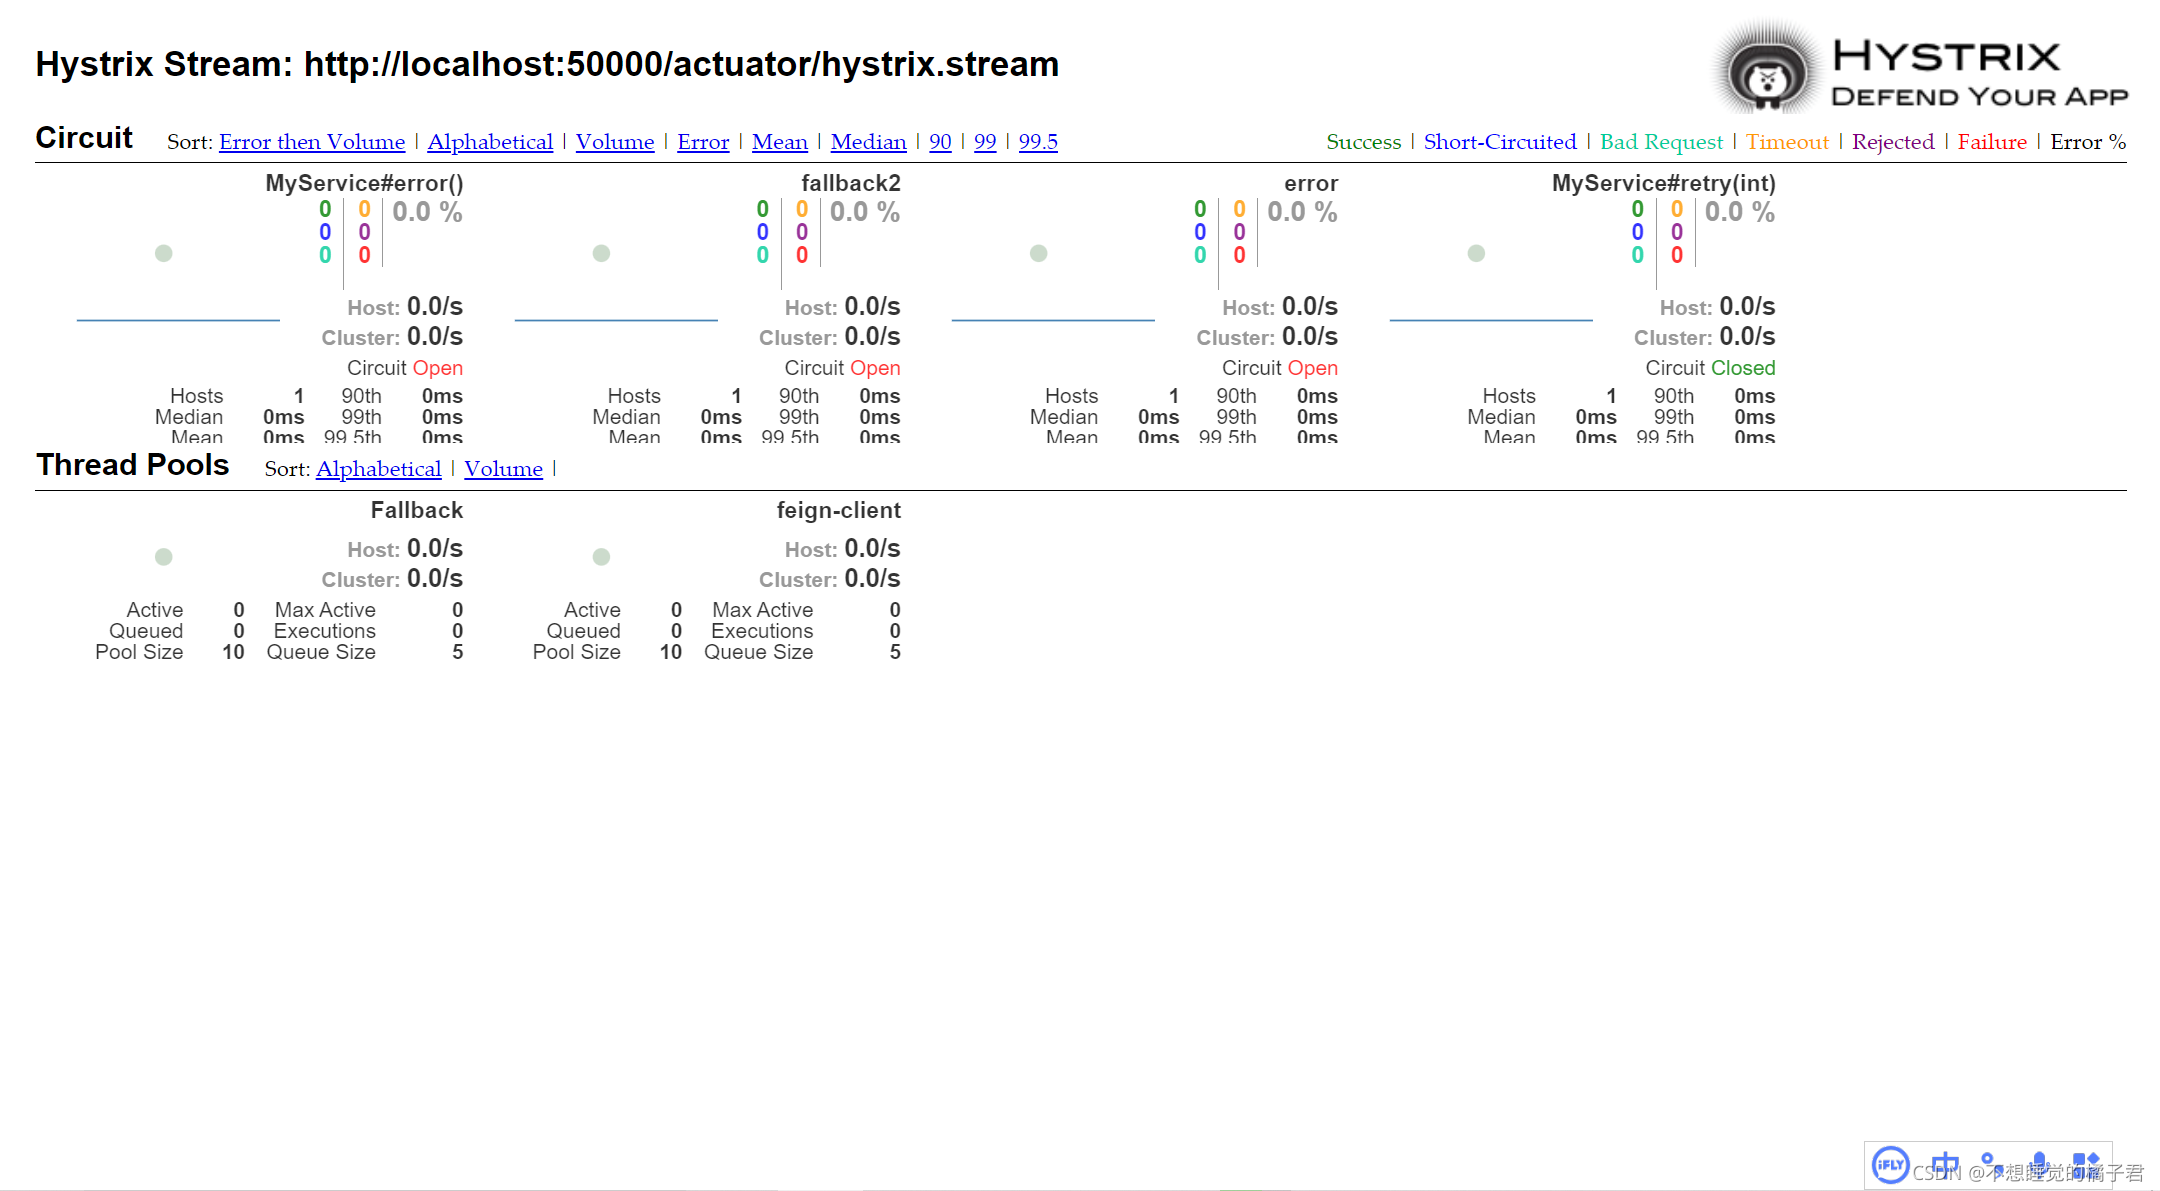
 监控路径
 Hystrix监控路径
 http://localhost:50000/actuator/hystrix.stream
 Turbine监控路径
 http://localhost:52000/turbine.stream
打开turbine的监控路径即可看到dashboard大盘监控。
 哦对了,补充下,turbine的配置文件那里是有个坑的。
cluster-name-expression: "'default'"
这个配置项是yml的形式,它需要在双引号里再加个单引号,配置才能生效。
而properties格式的配置文件,只需要一个双引号即可生效。


 被折叠的 条评论
为什么被折叠?
被折叠的 条评论
为什么被折叠?
 到【灌水乐园】发言


