


springcloud提供的熔断监测,实际上是对项目中用到feign或者ribbon远程服务调用并开启熔断机制hystrix的服务,也就是说这个服务必须满足两个条件,第一是作为一个服务消费者来消费服务的,第二是需要开启熔断机制,只有满足这两个条件的服务才可以被熔断监测平台来监测到,也就是说一般的服务提供者是无需做熔断监测的。
熔断监测,可以单独运行,因此单独开启一个项目,springcloud入门系列里面熔断监测项目叫monitor,他需要监测的服务就是这里的网关项目gateway,因为只有他才调用远程服务feign和robbin,而且开启了熔断机制。
熔断监测,可以监测单应用,也可以监测集群,这个示例只是用来监测单实例应用的。他就需要依赖spring-cloud-starter-netflix-hystrix-dashboard即可,另外,如果需要监测集群,可以加入spring-cloud-starter-netflix-turbine,项目依赖如下所示:
<dependency>
	<groupId>org.springframework.cloud</groupId>
	<artifactId>spring-cloud-starter</artifactId>
	<version>2.0.1.RELEASE</version>
</dependency>
<dependency>
	<groupId>org.springframework.cloud</groupId>
	<artifactId>spring-cloud-starter-netflix-hystrix-dashboard</artifactId>
	<version>2.0.1.RELEASE</version>
</dependency>
<dependency>
	<groupId>org.springframework.cloud</groupId>
	<artifactId>spring-cloud-starter-netflix-turbine</artifactId>
	<version>2.0.1.RELEASE</version>
</dependency>
编写一个启动类:
package com.xxx.monitor;

import org.springframework.boot.SpringApplication;
import org.springframework.boot.autoconfigure.SpringBootApplication;
import org.springframework.cloud.netflix.eureka.EnableEurekaClient;
import org.springframework.cloud.netflix.hystrix.dashboard.EnableHystrixDashboard;
import org.springframework.cloud.netflix.turbine.EnableTurbine;

@SpringBootApplication
@EnableEurekaClient
@EnableHystrixDashboard
@EnableTurbine
public class MonitorApplication {
    public static void main(String[] args) {
        SpringApplication.run(MonitorApplication.class,args);
    }
}
配置文件application.yml
server:
  port: 8989
bootstrap.yml
spring:
  application:
    name: monitor
eureka:
  instance:
    non-secure-port: ${server.port:8989}
  client:
    service-url:
      defaultZone: http://localhost:8761/eureka/
启动项目,我们通过浏览器访问http://localhost:8989/hystrix得到如下页面:
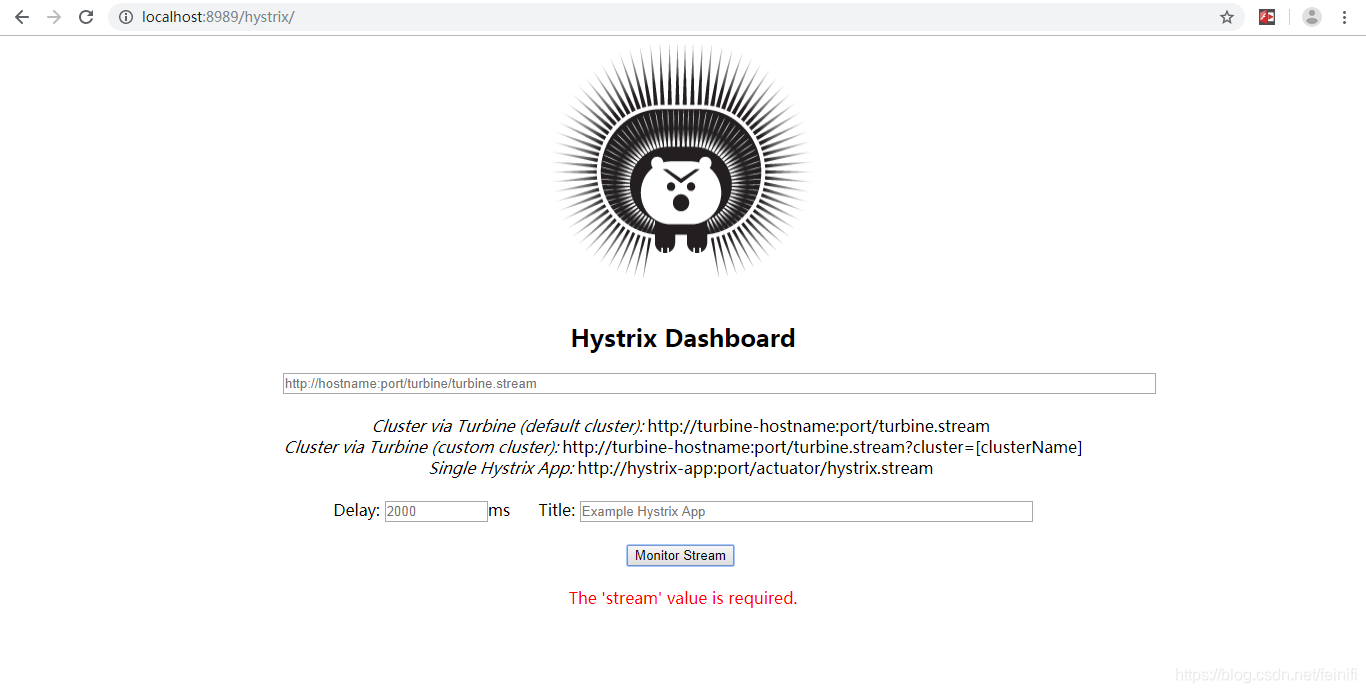
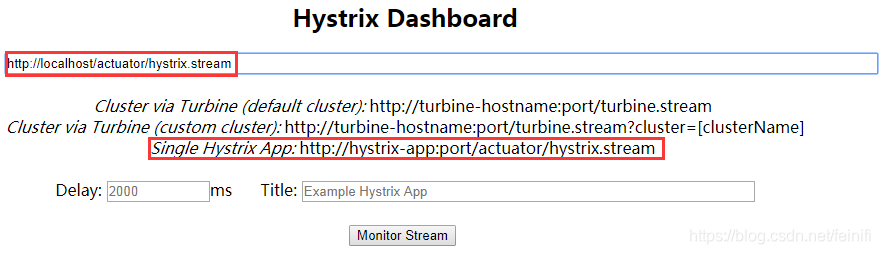
这个页面就是我们的熔断监测仪表盘,需要监测哪个服务,我们需要在第一个输入框中按照我们应用的类型输入相关服务hystrix监测地址,这里是单应用,因此我们需要按照提示的Single Hystrix App的样子输入服务监测地址。 因为我们的gateway服务对外暴露的端口是80,访问时可以直接输入主机名,忽略端口号,如:http://localhost,后面还需要加上/actuator/hystrix.stream
另外,因为springcloud版本的问题,我们输入要监测的服务地址http://localhost/actuator/hystrix.stream,访问页面会出现错误:
Unable to connect to Command Metric Stream.
出现这个错误的原因是springcloud对作为eureka client的项目访问做了权限设置,默认只容许访问actuator/info,actuator/health这两个endpoint,而actuator/hystrix.stream这个uri被限制访问,这个错误的解决办法有两种,都是在需要做熔断监测的项目里面修改,这里就是gateway项目了,只有他开启了熔断机制。
第一种解决办法,bootstrap.yml中增加一个配置项,对actuator/hystrix.stream请求放开:
management:
  endpoints:
    web:
      exposure:
        include: "*"
第二种解决办法,增加一个bean配置,同样是需要放开actuator/hystrix.stream请求:
@Bean
public ServletRegistrationBean getServlet(){
	HystrixMetricsStreamServlet streamServlet = new HystrixMetricsStreamServlet();
	ServletRegistrationBean registrationBean = new ServletRegistrationBean(streamServlet);
	registrationBean.setLoadOnStartup(1);
	registrationBean.addUrlMappings("/actuator/hystrix.stream");
	registrationBean.setName("HystrixMetricsStreamServlet");
	return registrationBean;
}
这个bean可以配置在启动类中,也可以单独配置在一个有@Configuration注解的类中。
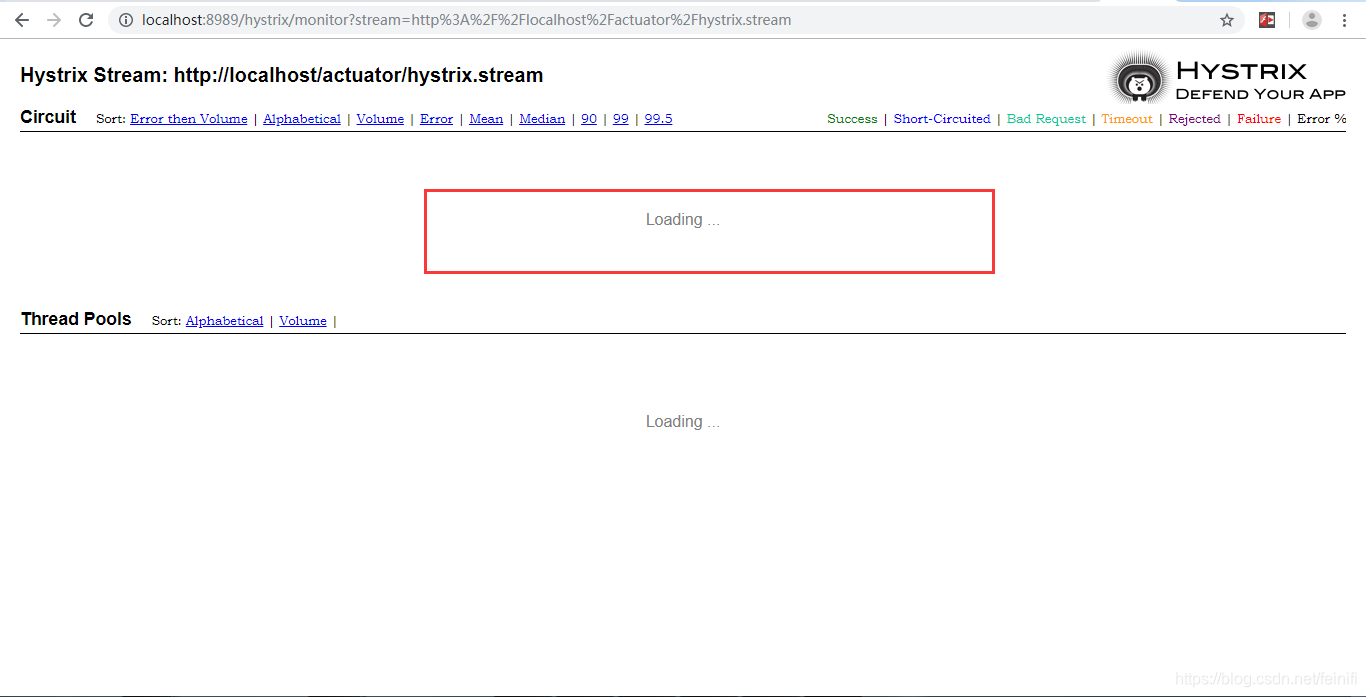
停止gateway项目,重新启动,我们再次访问刚才的页面,就不会出现:Unable to connect to Command Metric Stream错误了。而是出现loading,这是因为我们还没有访问我们开启熔断机制的服务。
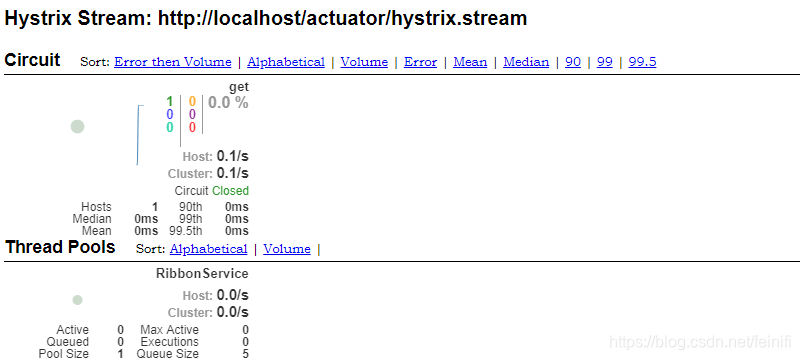
接着,我们切换到我们的gateway项目的主页,通过点击get message按钮,访问一下get()方法,这样再过来看这个监测页面,就变成了如下所示的样子:
至此,springcloud入门项目就都介绍完了,我们通过示例,构建了一个简单的应用,通过这些应用以及他们的角色了解了springcloud作为一个微服务解决方案在实际中的应用。如果有什么问题,可以回过去看springcloud入门系列的其他项目:


 1624
1624

 被折叠的 条评论
为什么被折叠?
被折叠的 条评论
为什么被折叠?
 到【灌水乐园】发言


