


 本文介绍了使用OpenLayers库在英文界面上实现的三种聚类算法:默认聚类、按区域属性聚类和按空间网格聚类,展示了如何处理500条记录的原始数据分布情况,并提供了相应的JavaScript代码示例。
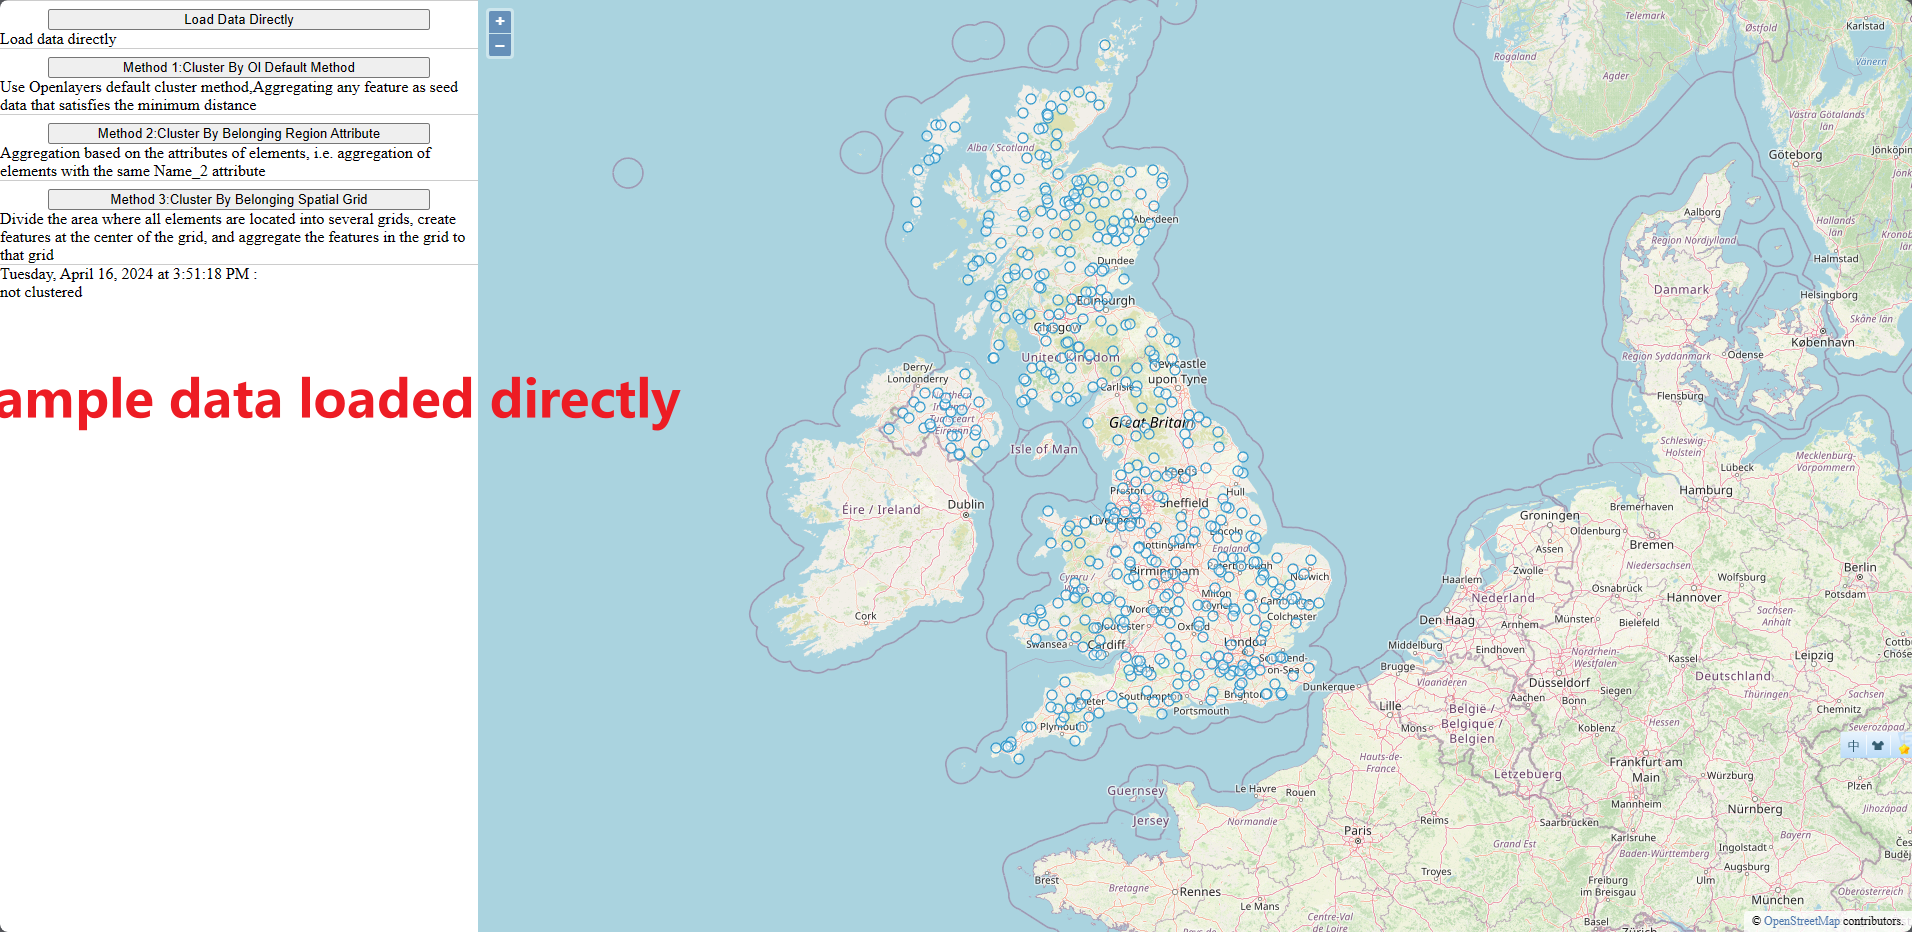
原始数据分布
给老外做的Demo,所以是英文界面。
原始数据分布情况如下:
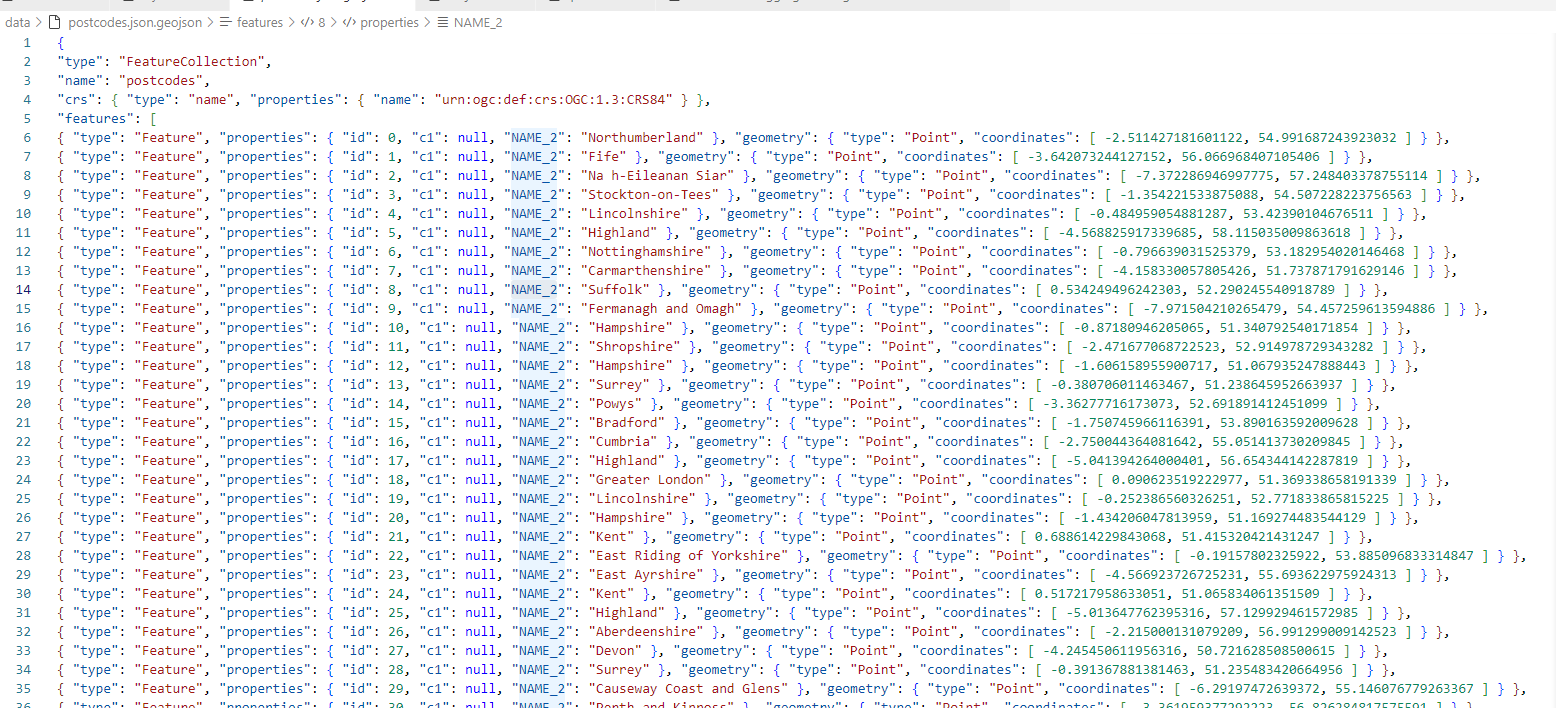
geojson文本内容:
三种方法基本原理
三种聚合算法来做一个例子(500条记录)。
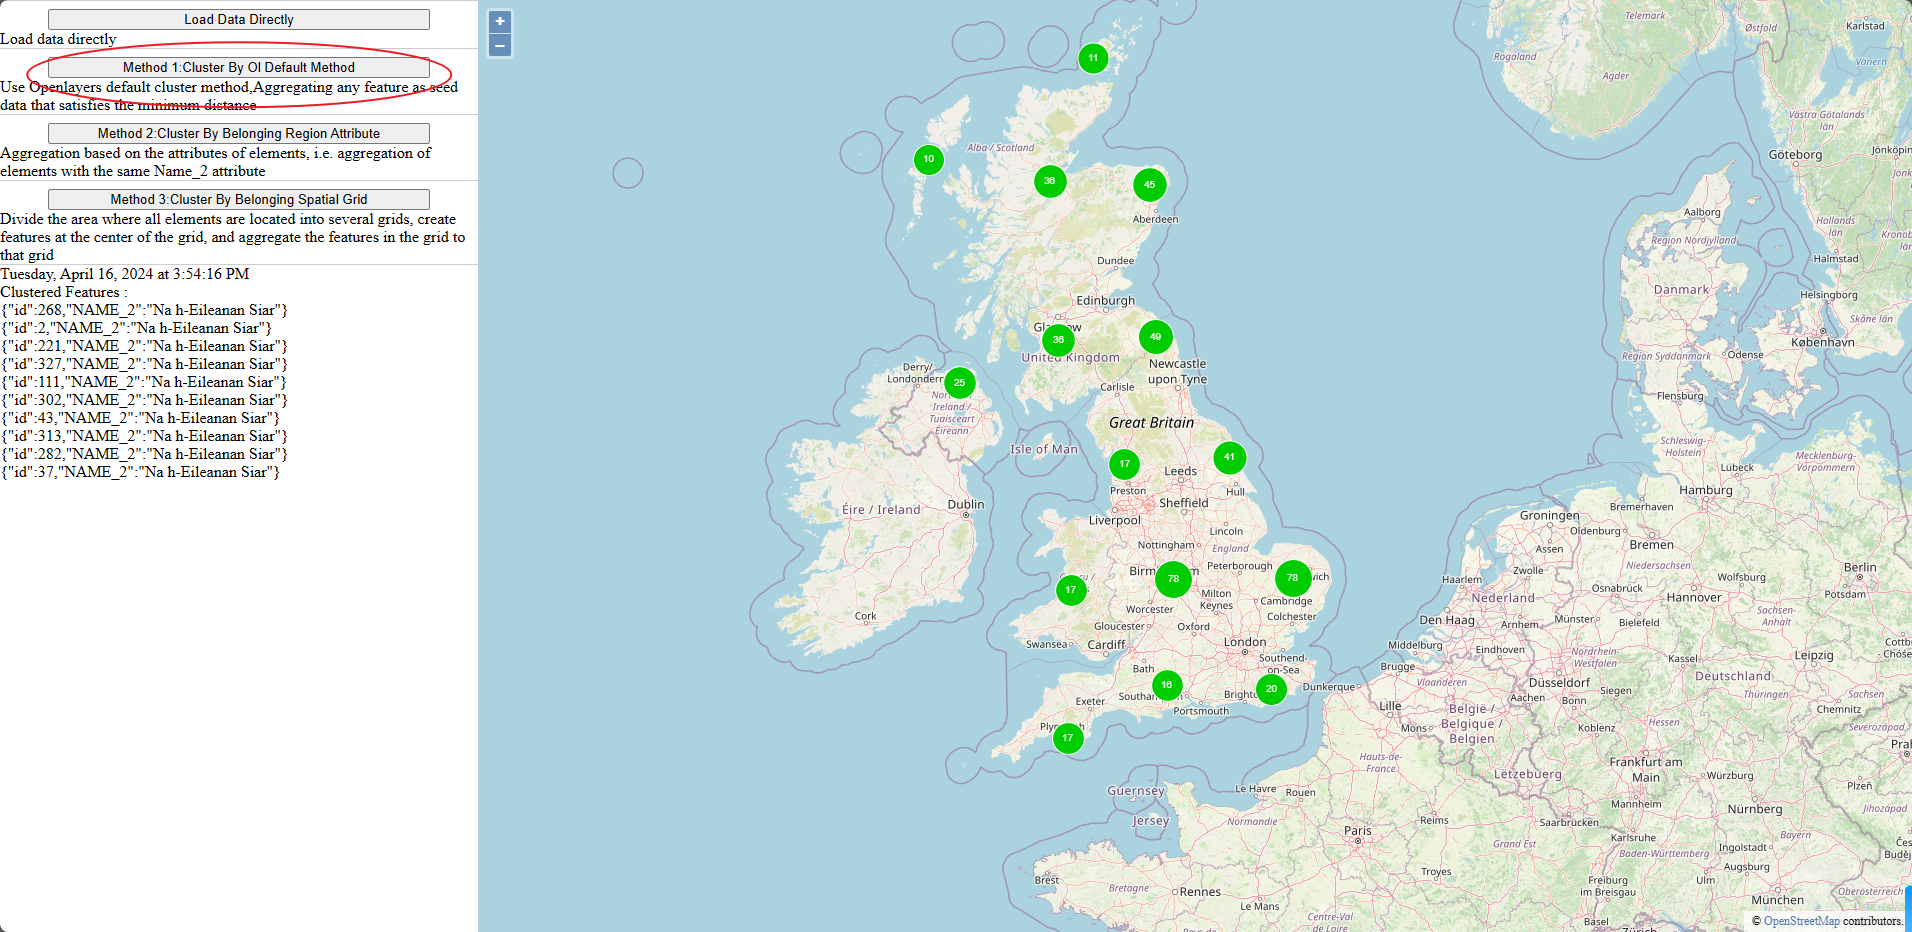
方法1:
按Ol默认方法进行聚类,使用Openlayers默认聚类方法,将任何特征聚合为满足最小距离的种子数据
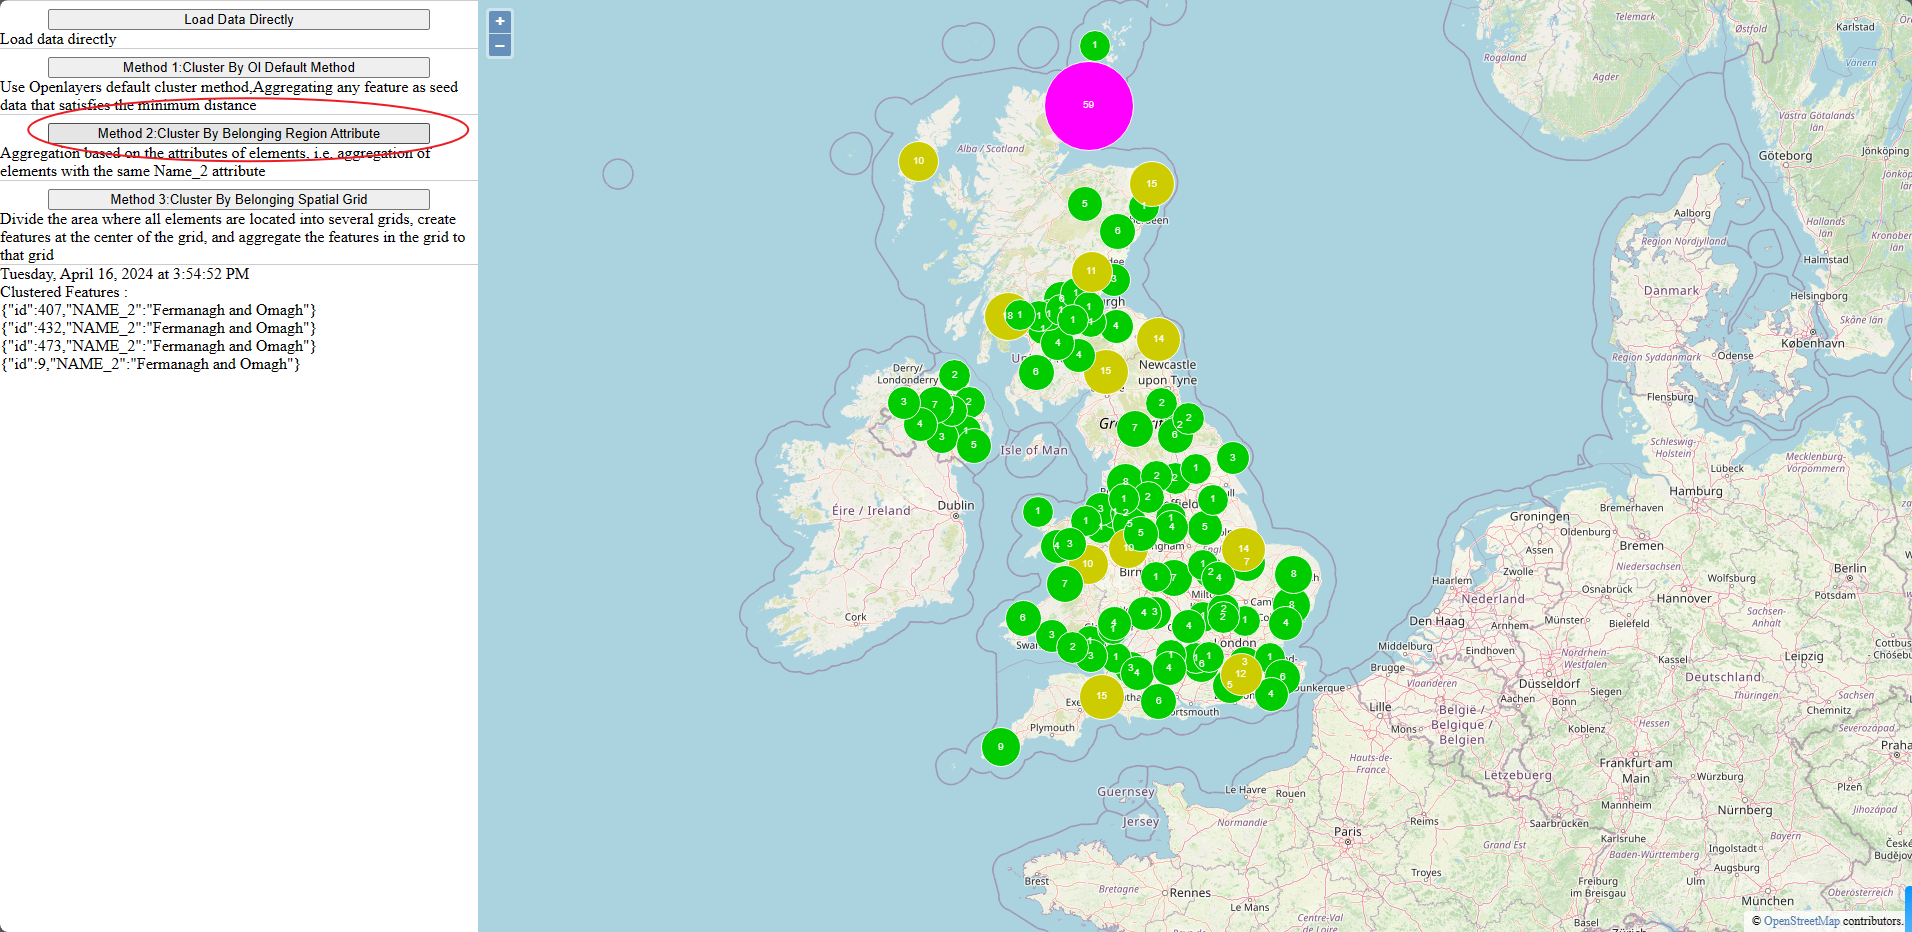
方法2:
按所属区域属性进行聚类,根据元素的属性进行聚合,即具有相同Name_2属性的元素的聚合
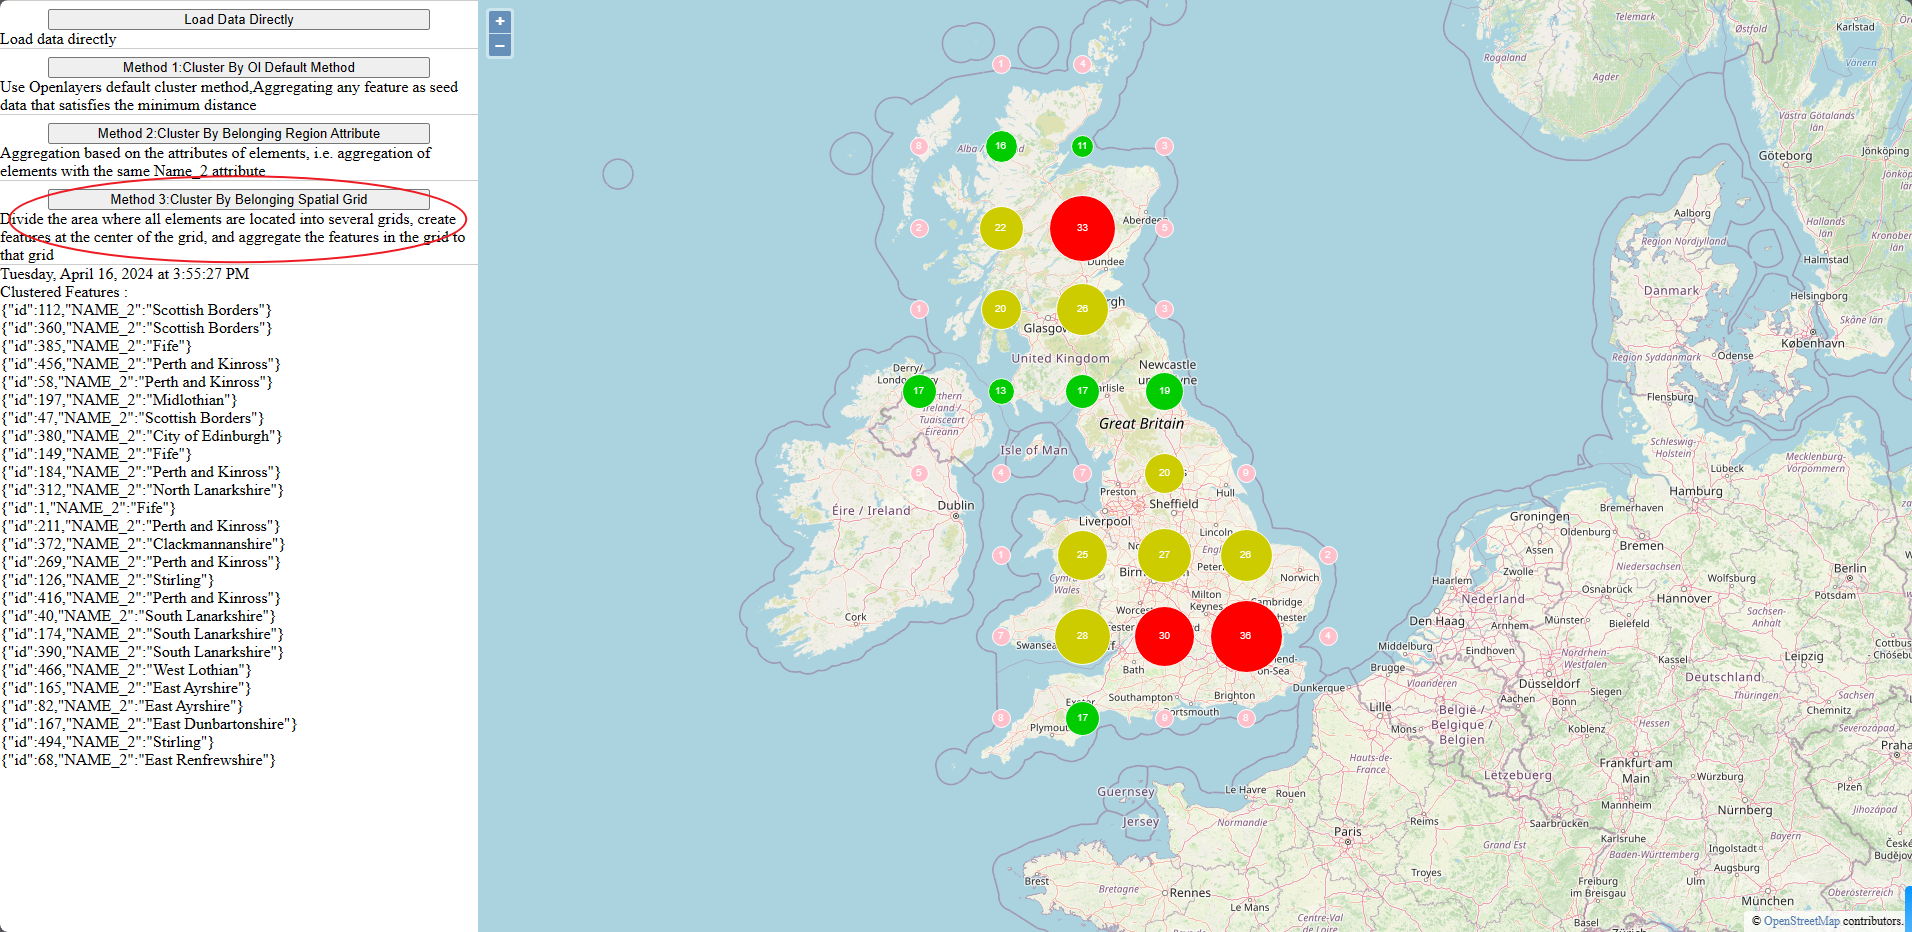
方法3:
按所属空间网格进行聚类,将所有元素所在的区域划分为多个网格,在网格的中心创建特征,并将网格中的特征聚合到该网格中
上代码
JavaScript
var myMap = null;
var vectorLayerForOrginalMap = null;
var clusterLayerByOLMethod = null;
var clusterLayerByBelongsRegion = null;
var clusterLayerByBelongsGrid = null;
var lastSelectedFeature = null;
const initMap = () => {
  const raster = new ol.layer.Tile({
    source: new ol.source.OSM(),
  });
  const map = new ol.Map({
    layers: [raster],
    target: "map",
    view: new ol.View({
      center: [-137702.88482159126, 7165549.988880951],
      zoom: 6,
    }),
  });
  myMap = map;
  showTip();
};
const removeAllVecLayers = () => {
  if (!myMap) return;
  vectorLayerForOrginalMap && myMap.removeLayer(vectorLayerForOrginalMap);
  clusterLayerByOLMethod && myMap && myMap.removeLayer(clusterLayerByOLMethod);
  clusterLayerByBelongsRegion && myMap.removeLayer(clusterLayerByBelongsRegion);
  clusterLayerByBelongsGrid && myMap.removeLayer(clusterLayerByBelongsGrid);
};
const loadData = () => {
  removeAllVecLayers();
  const vectorSource = createVectorSource();
  const vectorLayer = new ol.layer.Vector({
    source: vectorSource,
  });
  vectorLayerForOrginalMap = vectorLayer;
  myMap && myMap.addLayer(vectorLayer);
};
// 方法一★★★★★★
const loadDataClusterOl = () => {
  removeAllVecLayers();

  const clusterSource = new ol.source.Cluster({
    distance: 100,
    minDistance: 80,
    source: createVectorSource(),
  });

  const styleCache = {};
  clusterLayerByOLMethod = new ol.layer.Vector({
    source: clusterSource,
    style: function (feature) {
      const size = feature.get("features").length;
      let style = styleCache[size];
      if (!style) {
        style = createStyle(15 + size / 20.0, `${size.toString()}`);
        styleCache[size] = style;
      }
      return style;
    },
  });
  myMap && myMap.addLayer(clusterLayerByOLMethod);
};
// 方法二★★★★★★
const loadDataClusterRegion = () => {
  removeAllVecLayers();
  const vectorSource = createVectorSource();

  const styleCache = {};
  clusterLayerByBelongsRegion = new ol.layer.Vector({
    source: vectorSource,
    style: function (feature) {
      let size = feature.features && feature.features.length;
      !size && (size = 15);
      let style = styleCache[size];
      if (!style) {
        style = createStyle(15 + size / 2.0, `${size.toString()}`);
        styleCache[size] = style;
      }
      return style;
    },
  });
  myMap && myMap.addLayer(clusterLayerByBelongsRegion);
  vectorSource.on("featuresloadend", function () {
    loadDataClusterRegionLoaded(vectorSource);
  });
};
const loadDataClusterRegionLoaded = (vectorSource) => {
  const fsMap = new Map();
  const fs = vectorSource.getFeatures();
  for (let i = 0; i < fs.length; i++) {
    const region = fs[i].getProperties()["NAME_2"];
    if (fsMap.has(region)) {
      fsMap.get(region).push(fs[i]);
      fs[i].del = true;
      continue;
    }
    if (!fs[i].features && !fs[i].del) {
      fs[i].features = [fs[i]];
      fsMap.set(region, fs[i].features);
      continue;
    }
  }
  for (let i = fs.length - 1; i >= 0; i--) {
    if (fs[i].del) {
      vectorSource.removeFeature(fs[i]);
    }
  }
};
// 方法三★★★★★★
const loadDataClusterGrid = () => {
  removeAllVecLayers();
  const vectorSource = createVectorSource();

  const styleCache = {};
  clusterLayerByBelongsGrid = new ol.layer.Vector({
    source: vectorSource,
    style: function (feature) {
      let size = feature.features && feature.features.length;
      !size && (size = 15);
      let style = styleCache[size];
      if (!style) {
        style = createStyle(size, `${size.toString()}`);
        styleCache[size] = style;
      }
      return style;
    },
  });
  myMap && myMap.addLayer(clusterLayerByBelongsGrid);
  vectorSource.on("featuresloadend", function () {
    loadDataClusterGridLoaded(vectorSource);
  });
};
const loadDataClusterGridLoaded = (vectorSource) => {
  const fs = vectorSource.getFeatures();
  const ext = vectorSource.getExtent();
  const disX = 200000,
    disY = 200000;
  const minX = ext[0],
    minY = ext[1];
  const maxX = ext[2],
    maxY = ext[3];
  for (let i = minX; i <= maxX; i += disX) {
    for (let j = minY; j <= maxY; j += disY) {
      const centerX = i + disX / 2,
        centerY = j + disY / 2;
      var feature = new ol.Feature();
      feature.features = [];
      feature.setGeometry(new ol.geom.Point([centerX, centerY]));
      for (let k = 0; k < fs.length; k++) {
        if (fs[k].del) continue;
        const geometry = fs[k].getGeometry();
        const coordinates = geometry.getCoordinates();
        const x = coordinates[0],
          y = coordinates[1];
        if (x <= i || x > i + disX) continue;
        if (y <= j || y > j + disY) continue;
        fs[k].del = true;
        feature.features.push(fs[k]);
      }
      feature.features.length > 0 && vectorSource.addFeature(feature);
    }
  }

  for (let i = fs.length - 1; i >= 0; i--) {
    vectorSource.removeFeature(fs[i]);
  }
};
const createVectorSource = () => {
  return new ol.source.Vector({
    url: "./data/postcodes.json.geojson",
    format: new ol.format.GeoJSON(),
  });
};
const createStyle = (size, text) => {
  size < 10 && (size = 9);
  let fillColors = {
    0: "pink",
    1: "#0c0",
    2: "#cc0",
    3: "#f00",
    4: "#f0f",
    5: "#0ff",
    6: "#00f",
  };
  return new ol.style.Style({
    image: new ol.style.Circle({
      radius: size,
      stroke: new ol.style.Stroke({
        color: "#fff",
      }),
      fill: new ol.style.Fill({
        color: fillColors[`${Math.floor(size / 10)}`],
      }),
    }),
    text: new ol.style.Text({
      text: text,
      fill: new ol.style.Fill({
        color: "#fff",
      }),
    }),
  });
};
const showTip = () => {
  myMap.on("pointermove", function (event) {
    var feature = myMap.forEachFeatureAtPixel(event.pixel, function (feature) {
      return feature;
    });

    lastSelectedFeature && lastSelectedFeature.setStyle();
    if (feature) {
        lastSelectedFeature = feature;
        lastSelectedFeature.setStyle(new ol.style.Style());
      const tooltip = document.getElementById("info");
      // Get the feature information
      const fs = feature.features || feature.getProperties()["features"];
      const date = new Date();
      const options = {
        weekday: "long",
        year: "numeric",
        month: "long",
        day: "numeric",
        hour: "numeric",
        minute: "numeric",
        second: "numeric",
      };
      const stringDate = date.toLocaleDateString("en-US", options);
      if (!fs) {
        tooltip.innerHTML = `${stringDate} : <br>not clustered`;
        return;
      }
      const infos = [];
      for (let i = 0; i < fs.length; i++) {
        const f = fs[i];
        infos.push(
          JSON.stringify({
            id: f.getProperties()["id"],
            NAME_2: f.getProperties()["NAME_2"],
          })
        );
      }
      tooltip.innerHTML = `${stringDate}<br>Clustered Features : <br>${infos.join("<br>")}`;
    }
  });
};
HTML 页面
<!DOCTYPE html>
<html>

<head>
    <title>Cluster UK Postcodes </title>
    <link rel="stylesheet" href="style.css">
    <link rel="stylesheet" href="libs/ol.css">
    <script src="./libs/ol.js" type="text/javascript"></script>
    <script src="do.js" type="text/javascript"></script>
</head>

<body>
    <div class="mcontainer">
        <div class="leftPanel">
            <div>
                <button onclick="loadData();">Load Data Directly</button>
                <span>Load data directly</span>
            </div>
            <div>
                <button onclick="loadDataClusterOl();">Method 1:Cluster By Ol Default Method</button>
                <span>Use Openlayers default cluster method,Aggregating any feature as seed data that satisfies the
                    minimum distance</span>
            </div>
            <div>
                <button onclick="loadDataClusterRegion();">Method 2:Cluster By Belonging Region Attribute</button>
                <span>Aggregation based on the attributes of elements, i.e. aggregation of elements with the same Name_2
                    attribute</span>
            </div>
            <div>
                <button onclick="loadDataClusterGrid();">Method 3:Cluster By Belonging Spatial Grid</button>
                <span>Divide the area where all elements are located into several grids, create features at the center
                    of the grid, and aggregate the features in the grid to that grid</span>
            </div>
            <div id="info"></div>
        </div>
        <div class="rightPanel">
            <div id="map"></div>
        </div>
    </div>
    <script type="text/javascript">
        initMap();
    </script>
</body>

</html>
CSS
html,
body {
  margin: 0;
  padding: 0;
  height: 100%;
}
.mcontainer {
  display: flex;
  height: 100%;
}
.leftPanel {
  width: 25%;
  height: 100%;
  display: flex;
  flex-direction: row;
  flex-flow: column;
  overflow-y: auto;
  box-shadow: -5px 0px 0px 0px black, 5px 0px 0px 0px black;
}
.rightPanel {
  width: 75%;
  height: 100%;
}
#map {
  width: 100%;
  height: 100%;
}
.leftPanel div {
  display: flex;
  flex-direction: row;
  flex-flow: column;
  overflow-y: auto;
  border-top: 1px solid #ccc;
}
button {
  display: block;
  width: 80%;
  align-self: center;
  margin-top:.5rem;
}
#info {
  border-top: 1px solid #ccc;
}
效果图
三种算法的不同效果如下:


 875
875

 被折叠的 条评论
为什么被折叠?
被折叠的 条评论
为什么被折叠?
 到【灌水乐园】发言


