


In the world of data visualization, structure often determines clarity. Recently, the powerful mobile charting app ChartStudio released a major update — now supporting Tree Diagrams for hierarchical data visualization.
This update means you can now create and present complex organizational or categorical structures — such as company hierarchies or product categories — directly from your phone or tablet.
Download here:
https://apps.apple.com/app/apple-store/id6474099675?pt=126369107&ct=BJH&mt=8
1. What Is ChartStudio?
ChartStudio is an all-in-one data visualization tool that combines multi-chart creation, high-quality exports, and cross-device sync.
It’s designed for analysts, product managers, marketers, researchers, educators, and anyone who needs to turn data into insight.
Key features:
- Supports a wide range of chart types: bar, line, pie, radar, Sankey, heatmap, and the newly added Tree Diagram.
- High-resolution export for use in presentations, reports, and publications.
- Flexible data import from Excel, CSV, or Google Sheets.
- Cross-platform support: iPhone, iPad, Mac, and Apple Vision.
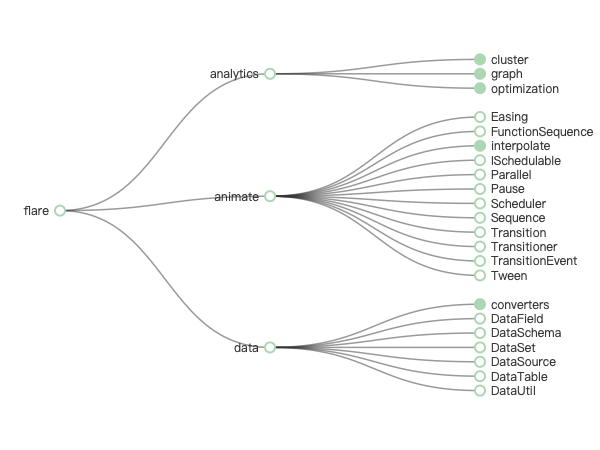
2. New Feature: Tree and Radial Tree Diagrams
This update introduces Tree Diagrams and Radial Tree Diagrams, enabling clear visualization of hierarchical and categorical relationships.
Typical use cases include:
- Company organizational charts
- Product category structures
- Family trees
- Mind maps and conceptual hierarchies
Unlike traditional tables, a tree diagram displays relationships visually, making complex structures easier to understand.
Highlights:
- Automatic hierarchy recognition — identifies parent-child relationships instantly.
- Radial layout option — visualize structures in a circular format that saves space and looks elegant.
- Adaptive color and node sizing — emphasize data importance through visual hierarchy.
- Mobile-first visualization — create complex structural charts in minutes without desktop software.
3. Use Cases
| Scenario | Example |
|---|---|
| Company reports | Display organizational hierarchy |
| Product management | Show product → module → feature relationships |
| Market analysis | Visualize brand, series, and item categories |
| Education | Illustrate knowledge hierarchies or mind maps |
| Website structure | Represent site navigation or content hierarchy |
Tree Diagrams in ChartStudio transform static data into dynamic, visual storytelling.
4. Download & System Requirements
Download ChartStudio:
https://apps.apple.com/app/apple-store/id6474099675?pt=126369107&ct=BJH&mt=8
Requirements:
- iOS 14.0 or later
- macOS 11.0 or later
- Compatible with iPhone, iPad, Mac, and Apple Vision
Note: Some advanced features or high-resolution exports may require in-app purchases or subscription.
5. Conclusion
Data should be not only accurate but also beautifully structured.
The new Tree Diagram feature in ChartStudio brings a new dimension to mobile data visualization — allowing users to present hierarchies clearly, elegantly, and professionally.
If you often deal with structured data or hierarchical relationships, this update is a must-try.
Download now and let your data tell a story:
https://apps.apple.com/app/apple-store/id6474099675?pt=126369107&ct=BJH&mt=8


 1万+
1万+

 被折叠的 条评论
为什么被折叠?
被折叠的 条评论
为什么被折叠?
 到【灌水乐园】发言


