#使用plot()绘制折线图
import numpy as np
import matplotlib.pyplot as plt
arr = np.array([[1, 2, 3], [4, 5, 6], [7, 8, 9], [10, 11, 12]])
plt.plot(arr[0], arr[1:])

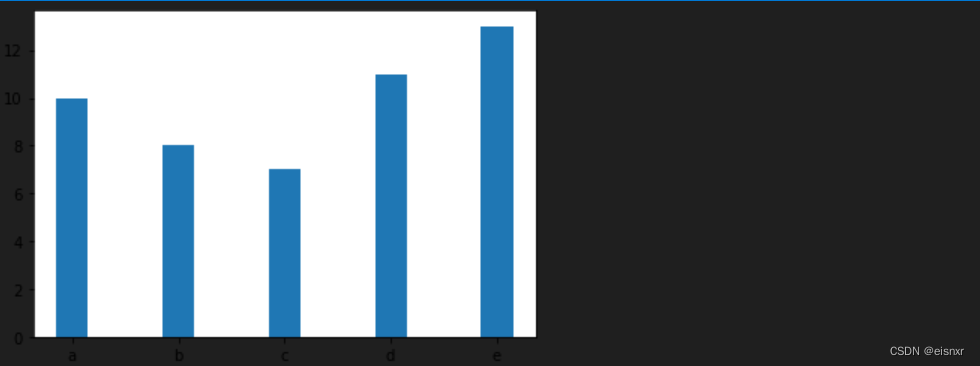
#使用bar()绘制柱形图或堆积柱形图
import numpy as np
import matplotlib.pyplot as plt
x = np.arange(5)
y1 = np.array([10, 8, 7, 11, 13])
# 柱形的宽度
bar_width = 0.3
# 绘制柱形图
plt.bar(x, y1, tick_label=['a', 'b', 'c', 'd', 'e'], width=bar_width)
plt.show()
x = np.arange(5)
y1 = np.array([10, 8, 7, 11, 13])
y2 = np.array([9, 6, 5, 10, 12])
# 柱形的宽度
bar_width = 0.3
# 根据多组数据绘制柱形图
plt.bar(x, y1, tick_label=['a', 'b', 'c',


 最低0.47元/天 解锁文章


 915
915

 被折叠的 条评论
为什么被折叠?
被折叠的 条评论
为什么被折叠?
 到【灌水乐园】发言


