


 本文介绍使用QtCharts库绘制曲线的基础步骤及美化技巧。重点包括QChartView、QChart和QSplineSeries三个核心组件,以及如何设置坐标轴范围、刻度和网格线,使图表更加直观易读。
QtCharts第一章:绘制曲线
摘要:Qt开发应用程序时,常用到曲线绘制,以往主要用第三方Qwt库,Qt5.7以上版本已经自带了QtCharts用于曲线绘制。本文主要讲解利用QtCharts绘制曲线的基本步骤,同时讲解一些修饰曲线,使其更加美观的骚操作。
绘图三要素
绘制一个曲线,要有三个要素(类)组成,其一是画布QChartView,其二是图形QChart,其三是曲线QSplineSeries(或其他)。
| 类名 | 描述 |
|---|---|
| QChartView | 用于显示曲线 |
| QChart | 相当于QwtPlot,图表框架 |
| QSplineSeries | 相当于QwtPlotCurve,曲线,有多种类型 |
QChartView
QChart
坐标轴操作
设置坐标轴范围
函数名称:void QAbstractAxis::setRange(const QVariant &min, const QVariant &max)
函数描述:Sets the range shown on the axis. Depending on the actual axis type the min and max parameters are converted to appropriate types. If the conversion is impossible then the function call does nothing.
调用方法:
    chart->axisX()->setRange(0,2000);
    chart->axisY()->setRange(0,1000);
设置坐标轴刻度
函数名称:void QAbstractAxis::setRange(const QVariant &min, const QVariant &max)
函数描述:Sets the range shown on the axis. Depending on the actual axis type the min and max parameters are converted to appropriate types. If the conversion is impossible then the function call does nothing.
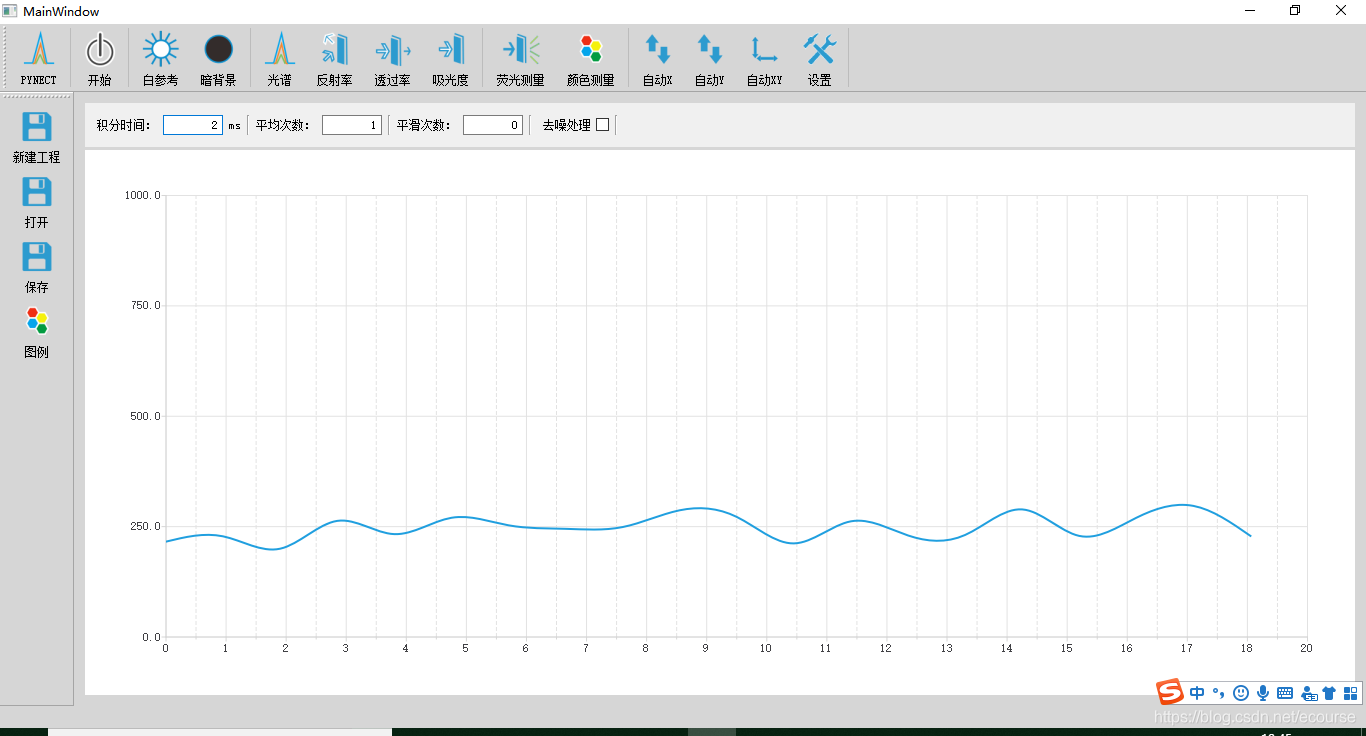
坐标轴综合代码和效果
	QValueAxis *axisX = new QValueAxis;
	axisX->setRange(0, 50);   //设置坐标轴范围
	axisX->setGridLineVisible(true);   //网格线可见
	axisX->setTickCount(20);  //设置坐标轴显示数字数目
	axisX->setMinorTickCount(3);   //设置每格小刻度线的数目
	axisX->setLabelFormat("%d");  //设置坐标轴显示数字,整数、N位小数等
	chartView->chart()->setAxisX(axisX, series);


 1876
1876

 被折叠的 条评论
为什么被折叠?
被折叠的 条评论
为什么被折叠?
 到【灌水乐园】发言


