


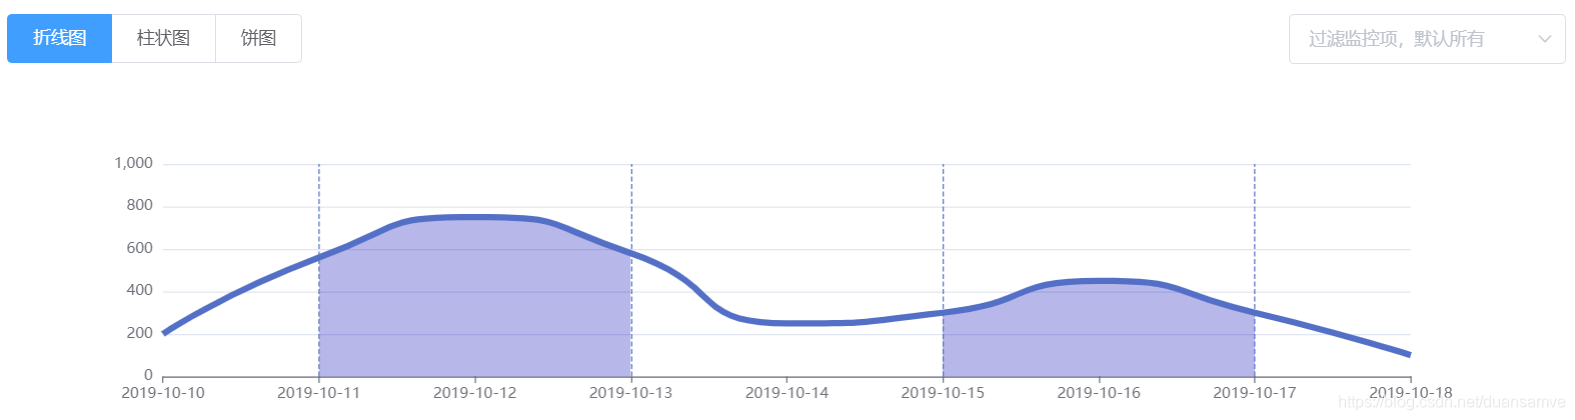
要实现的效果:
要点:
<component v-bind:is="currentTabComponent" class="tab"></component>index.vue:
<template>
      <el-card>
        <el-row>
          <el-col :span="12">
            <el-radio-group v-model="chartComponents">
              <el-radio-button label="lineChart">折线图</el-radio-button>
              <el-radio-button label="barChart">柱状图</el-radio-button>
              <el-radio-button label="pieChart">饼图</el-radio-button>
            </el-radio-group>
          </el-col>
          <el-col :span="12">
            <el-select
              v-model="value"
              placeholder="过滤监控项,默认所有"
              style="float: right;"
            >
              <el-option
                v-for="(item, index) in options"
                :key="index"
                :label="item.label"
                :value="item.value"
              ></el-option>
            </el-select>
          </el-col>
        </el-row>

        <div style="height: 300px; padding-top: 20px;">
          <component v-bind:is="currentTabComponent" class="tab"></component>
        </div>
      </el-card>
</template>

<script>
import lineChart from "./line-chart";
import barChart from "./bar-chart";
import pieChart from "./pie-chart";

export default {
  components: {
    lineChart,
    barChart,
    pieChart
  },
  data() {
    return {
      chartComponents: "lineChart"
    };
  },
  computed: {
    currentTabComponent() {
      return this.chartComponents;
    }
  }
};
</script>

<style scoped>

</style>
line-chart.vue:
<template>
  <div id="line-chart-container"></div>
</template>

<script>
export default {
  data() {
    return {};
  },
  methods: {
    drawLine() {
      const lineChart = this.$echarts.init(
        document.getElementById("line-chart-container")
      );

      const option = {
        xAxis: {
          type: "category",
          boundaryGap: false
        },
        yAxis: {
          type: "value",
          boundaryGap: [0, "30%"]
        },
        visualMap: {
          type: "piecewise",
          show: false,
          dimension: 0,
          seriesIndex: 0,
          pieces: [
            {
              gt: 1,
              lt: 3,
              color: "rgba(0, 0, 180, 0.4)"
            },
            {
              gt: 5,
              lt: 7,
              color: "rgba(0, 0, 180, 0.4)"
            }
          ]
        },
        series: [
          {
            type: "line",
            smooth: 0.6,
            symbol: "none",
            lineStyle: {
              color: "#5470C6",
              width: 5
            },
            markLine: {
              symbol: ["none", "none"],
              label: { show: false },
              data: [{ xAxis: 1 }, { xAxis: 3 }, { xAxis: 5 }, { xAxis: 7 }]
            },
            areaStyle: {},
            data: [
              ["2019-10-10", 200],
              ["2019-10-11", 560],
              ["2019-10-12", 750],
              ["2019-10-13", 580],
              ["2019-10-14", 250],
              ["2019-10-15", 300],
              ["2019-10-16", 450],
              ["2019-10-17", 300],
              ["2019-10-18", 100]
            ]
          }
        ]
      };

      lineChart.setOption(option);
    }
  },
  mounted(){
      this.drawLine();
  }
};
</script>

<style scoped>
#line-chart-container {
  height: 300px;
}
</style>
bar-chart.vue:
<template>
  <div id="bar-chart-container"></div>
</template>

<script>
export default {
  data() {
    return {};
  },
  methods: {
    drawBar() {
      const barChart = this.$echarts.init(
        document.getElementById("bar-chart-container")
      );

      const option = {
        title: {
          text: "阶梯瀑布图",
          subtext: "From ExcelHome",
          sublink: "http://e.weibo.com/1341556070/Aj1J2x5a5"
        },
        tooltip: {
          trigger: "axis",
          axisPointer: {
            // 坐标轴指示器,坐标轴触发有效
            type: "shadow" // 默认为直线,可选为:'line' | 'shadow'
          },
          formatter: function(params) {
            var tar;
            if (params[1].value !== "-") {
              tar = params[1];
            } else {
              tar = params[0];
            }
            return tar.name + "<br/>" + tar.seriesName + " : " + tar.value;
          }
        },
        legend: {
          data: ["支出", "收入"]
        },
        grid: {
          left: "3%",
          right: "4%",
          bottom: "3%",
          containLabel: true
        },
        xAxis: {
          type: "category",
          splitLine: { show: false },
          data: (function() {
            var list = [];
            for (var i = 1; i <= 11; i++) {
              list.push("11月" + i + "日");
            }
            return list;
          })()
        },
        yAxis: {
          type: "value"
        },
        series: [
          {
            name: "辅助",
            type: "bar",
            stack: "总量",
            itemStyle: {
              barBorderColor: "rgba(0,0,0,0)",
              color: "rgba(0,0,0,0)"
            },
            emphasis: {
              itemStyle: {
                barBorderColor: "rgba(0,0,0,0)",
                color: "rgba(0,0,0,0)"
              }
            },
            data: [0, 900, 1245, 1530, 1376, 1376, 1511, 1689, 1856, 1495, 1292]
          },
          {
            name: "收入",
            type: "bar",
            stack: "总量",
            label: {
              show: true,
              position: "top"
            },
            data: [900, 345, 393, "-", "-", 135, 178, 286, "-", "-", "-"]
          },
          {
            name: "支出",
            type: "bar",
            stack: "总量",
            label: {
              show: true,
              position: "bottom"
            },
            data: ["-", "-", "-", 108, 154, "-", "-", "-", 119, 361, 203]
          }
        ]
      };

      barChart.setOption(option);
    }
  },
  mounted() {
    this.drawBar();
  }
};
</script>

<style scoped>
#bar-chart-container {
  height: 300px;
}
</style>
pie-chart.vue:
<template>
  <div id="pie-chart-container"></div>
</template>

<script>
export default {
  data() {
    return {};
  },
  methods: {
    drawPie() {
      const pieChart = this.$echarts.init(
        document.getElementById("pie-chart-container")
      );

      var data = [
        {
          name: "Apples",
          value: 70
        },
        {
          name: "Strawberries",
          value: 68
        },
        {
          name: "Bananas",
          value: 48
        },
        {
          name: "Oranges",
          value: 40
        },
        {
          name: "Pears",
          value: 32
        },
        {
          name: "Pineapples",
          value: 27
        },
        {
          name: "Grapes",
          value: 18
        }
      ];

      const option = {
        title: [
          {
            text: "Pie label alignTo",
            left: "center"
          },
          {
            subtext: 'alignTo: "none" (default)',
            left: "16.67%",
            top: "75%",
            textAlign: "center"
          },
          {
            subtext: 'alignTo: "labelLine"',
            left: "50%",
            top: "75%",
            textAlign: "center"
          },
          {
            subtext: 'alignTo: "edge"',
            left: "83.33%",
            top: "75%",
            textAlign: "center"
          }
        ],
        series: [
          {
            type: "pie",
            radius: "25%",
            center: ["50%", "50%"],
            data: data,
            label: {
              position: "outer",
              alignTo: "none",
              bleedMargin: 5
            },
            left: 0,
            right: "66.6667%",
            top: 0,
            bottom: 0
          },
          {
            type: "pie",
            radius: "25%",
            center: ["50%", "50%"],
            data: data,
            label: {
              position: "outer",
              alignTo: "labelLine",
              bleedMargin: 5
            },
            left: "33.3333%",
            right: "33.3333%",
            top: 0,
            bottom: 0
          },
          {
            type: "pie",
            radius: "25%",
            center: ["50%", "50%"],
            data: data,
            label: {
              position: "outer",
              alignTo: "edge",
              margin: 20
            },
            left: "66.6667%",
            right: 0,
            top: 0,
            bottom: 0
          }
        ]
      };

      pieChart.setOption(option);
    }
  },
  mounted() {
    this.drawPie();
  }
};
</script>

<style scoped>
#pie-chart-container {
  height: 300px;
}
</style>


 被折叠的 条评论
为什么被折叠?
被折叠的 条评论
为什么被折叠?
 到【灌水乐园】发言


