


 本文深入探讨了数据科学中的关键概念,包括特征的类型(如离散和连续)、数据集的特性(如噪声、重复值和不一致数据)以及文本处理的方法,如分词和使用TF-IDF权重进行文本表示。强调了正确处理这些因素对于构建有效模型的重要性。
Features, Data, Text Processing
1. Features
-
Distinctness:
-
- = ≠
Order:
-
- < > ≤ ≥
Meaningful differences:
-
- .+ -
- (e.g. 08Oct 2018 is three days after 05 Oct 2018) Meaningful ratios:
-
- × ÷
- (e.g. Tom (18 years) is two times older than John (9 years)
-
Nomial (Categorical Qualitative):
- Any permutation of data
-
- Property: Distinctness
- e.g. gender, eye colour, postal codes Ordinal (Categorical Qualitative):
- An order preserving change of values. i.e., new_value = f(old_value), where f is a monotonic function
-
- Properties: Distinctness & Ordered
- e.g. school level (primary/secondary), grades Interval (Numeric Quantitative) [加减]:
- new_value = a*old_value + b, where a and b are constants
-
- Poperties: Distinctness & ordered & meaningful differences
- e.g. calendar dates, temperatures (Celsius or Fahrenheit) Ratio (Numeric Quantitative) [乘除]:
- new_value = a*old_value
-
- Properties: Distinctness & ordered & meaningful differences/ratios
- e.g. length, time, counts
Nomial, Ordinal, Interval and Ratio features can be represented by discrete or continuous values
-
Discrete Valure (including Binary):
-
- Finite or countable set of values
-
- Typically represented as integers
- e.g. course ID, postal codes Continuous Values
-
- Real values
-
- Typically represented as floats
- e.g. temperature, weight, height
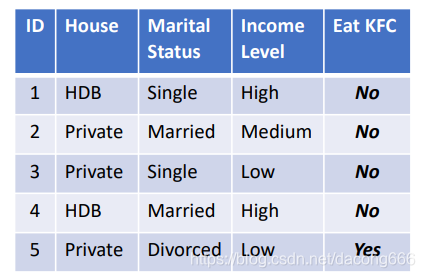
| Feature | Binary, Discrete, or Continuous? | Nominal, Odinal, Interval, Ratio? |
|---|---|---|
| Postal code | Discrete | Nominal |
| Gender | Binary | Nominal |
| Height/Weight | Continuous | Ratio |
| Student ID | Discrete | Nominal, Ordinal (if ID assigned by sequence |
| Grading system | Binary (P/F), Discrete (A+, …, F), Continuous (Scores) | Ordial, Ratio (scores) |
| Date | Discrete (MM/YY), Countinous (Time) | Interval |
2. Data
-
Dimensionality (no. of features)
-
- Challenges of high-dimensional data, “Curse of dimensionality”
Sparsity
-
- Advantage for computing time and space
-
e.g. In bag-of-words, most words will be zero (not used)
[bag-of-words 就是 disregarding grammar and even word order but keeping multiplicity – 一袋子words] Resolution
-
- Patterns depend on the scale
- e.g. Travel patterns on scale of hours, days, weeks
- Low quality dataset/ features lead to poor model
e.g. A classifier build with poor data/features may incorrectly diagnose a patient as being sick when he/she is not - possible issues wil dataset/ features
-
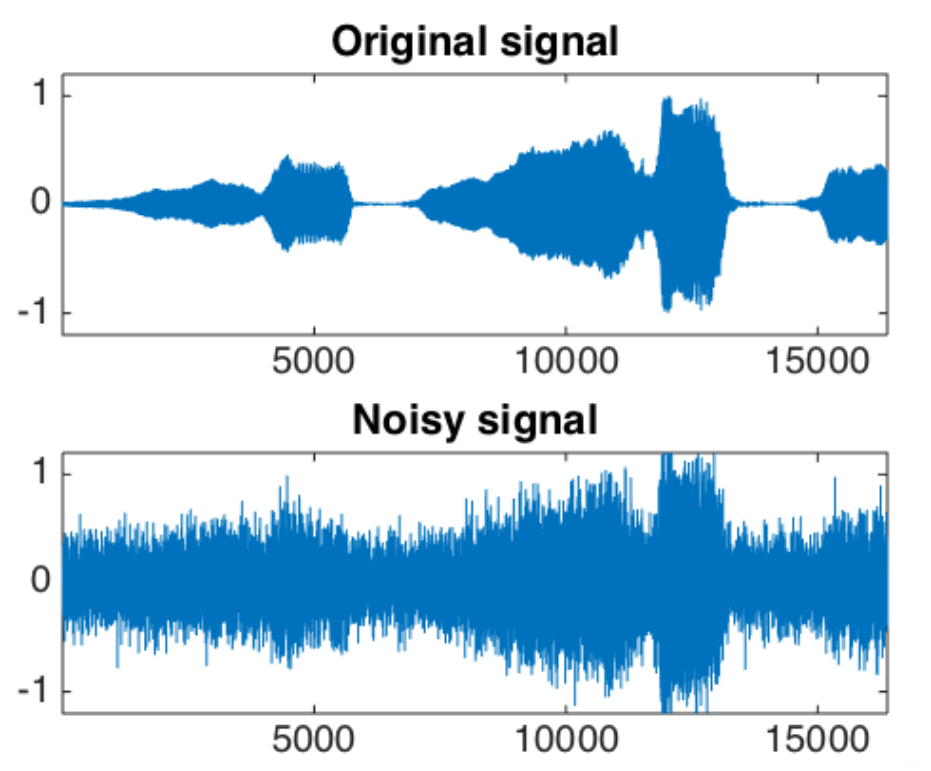
Noise
-
- For features, noise refers to random error/variance in original values
-
e.g. Recording of a concert with background noise
e.g. Check-in data on social media with GPS errors
 Outliers
-
- Anomalous objects:
Observations with characteristics that are considerably different than most other observations in the data set
- Anomalous objects:
-
- Anomalous Values:
Feature vaues that are unusual with respect to typical values for that feature
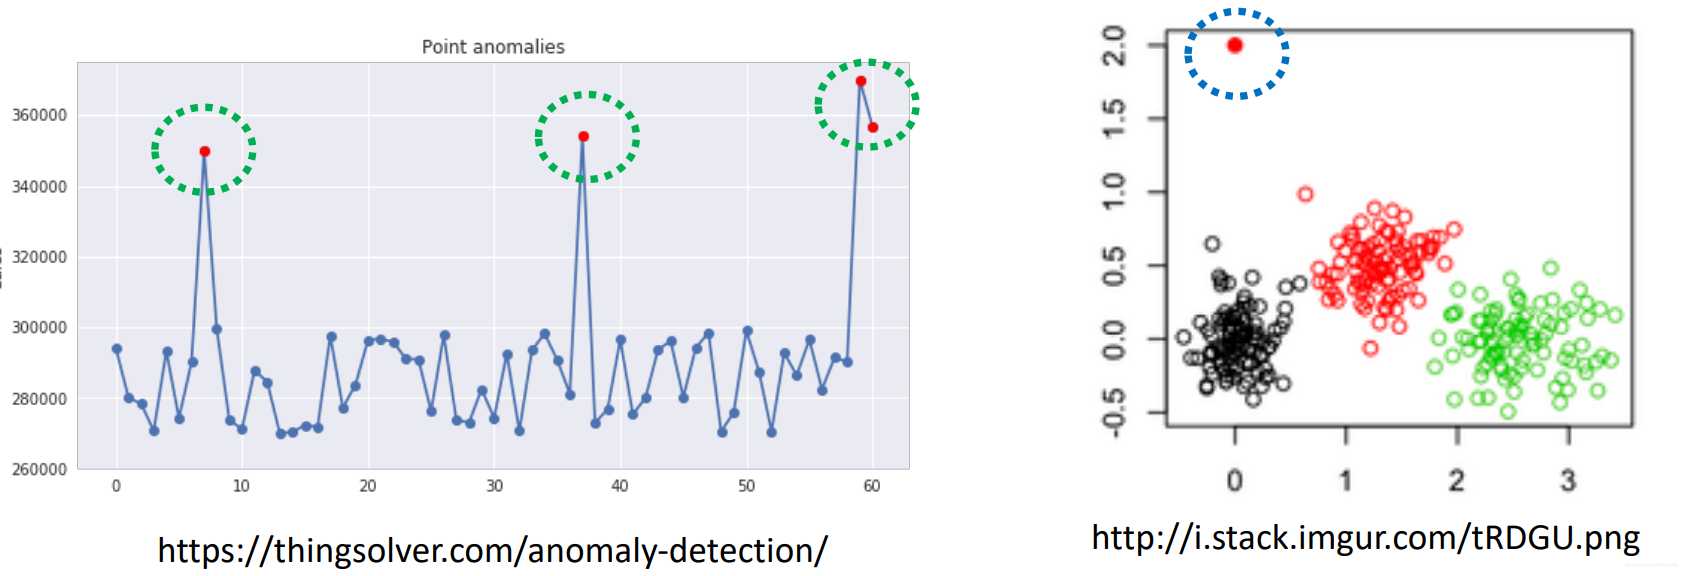
Noise VS Outliers
- Anomalous Values:
-
-
Noise: Due to random errors/variance in the data collection/measurement process --> we want to remove them (noise reduction/removal)
e.g. blurry images, moisy recordings
-
-
-
Outlier: Due to intresting events, which may have good/bad consequences --> we want to identify/detect them (anomaly detection)
e.g. sudden increase in web traffic, larger and odd online purchases
Missing values
-
-
- Reasons for missing values
-
Incomplete data collection
e.g. People not providing annual income
-
Features not applicable to certain observations
e.g. Annual income not applicable to children
-
- Reasons for missing values
-
- Types of missing values
-
Missing Completely at Random (MCAR)
Missing values are a completely random subsete.g. Data collection/survey is randomly lost.
-
Missing at Random (MAR)
Missing values related to some other featurese.g. Older adults not roviding annual income
-
Missing Not at Random (MNAR)
Missing values related to unobserved featurese.g. no knowing age and income
-
- Types of missing values
-
- What to do with missing values?
-
Eliminate observations or variables
Okay for MCAR values, may be not ok for MAR and MNAR values
Notice: we need to understand the effects of this eliminations! -
Estimate missing values
e.g. Using averages in a time series or spatial data
-
Ignore the missing value during analysis
e.g. KNN using features with values
-
Duplicate data
- What to do with missing values?
-
Data set may include data objects that are duplicates, or almost duplicates of one another --> Major issue when merging data from heterogeneous sources.
-
e.g. Same person with multiple email addresses
-
- Data cleaning
Process of dealing with duplicate data issue
Wring/Inconsistent data
- Data cleaning
-
Features may contain wrong or inconsistent values
e.g. User-provided street name and postal code not matching
e.g. Negative values for weight, height, age, etc -
- Ways to overcome wrong/inconsistent data
-
More stringent data collection
e.g. drop-down list for specific data input
-
Detect potentially wrong data values
e.g. allowable range for specific features
-
Correction of wrong/inconsistent values
e.g. correct postal code based on block number and street name
-
- Ways to overcome wrong/inconsistent data
Consider a dataset with the issues of noise, outliers, duplicate observations, missing values abnd wrong/inconsistent data.
What would be the possible problems of applyng the k-nearest neighbors (KNN) algorithm on this dataset? [KNN assigns an observation to the class lebal of the k-nearest neighbor with majority voting.]
- Noise/Outliers:
If k-value is too small, may be overly sensitive to noise/outlisers - Duplicate observations:
K-nearest neighbors may be all duplicates - Missing/wrong/inconsistent:
Distance measure may be inaccurate
-
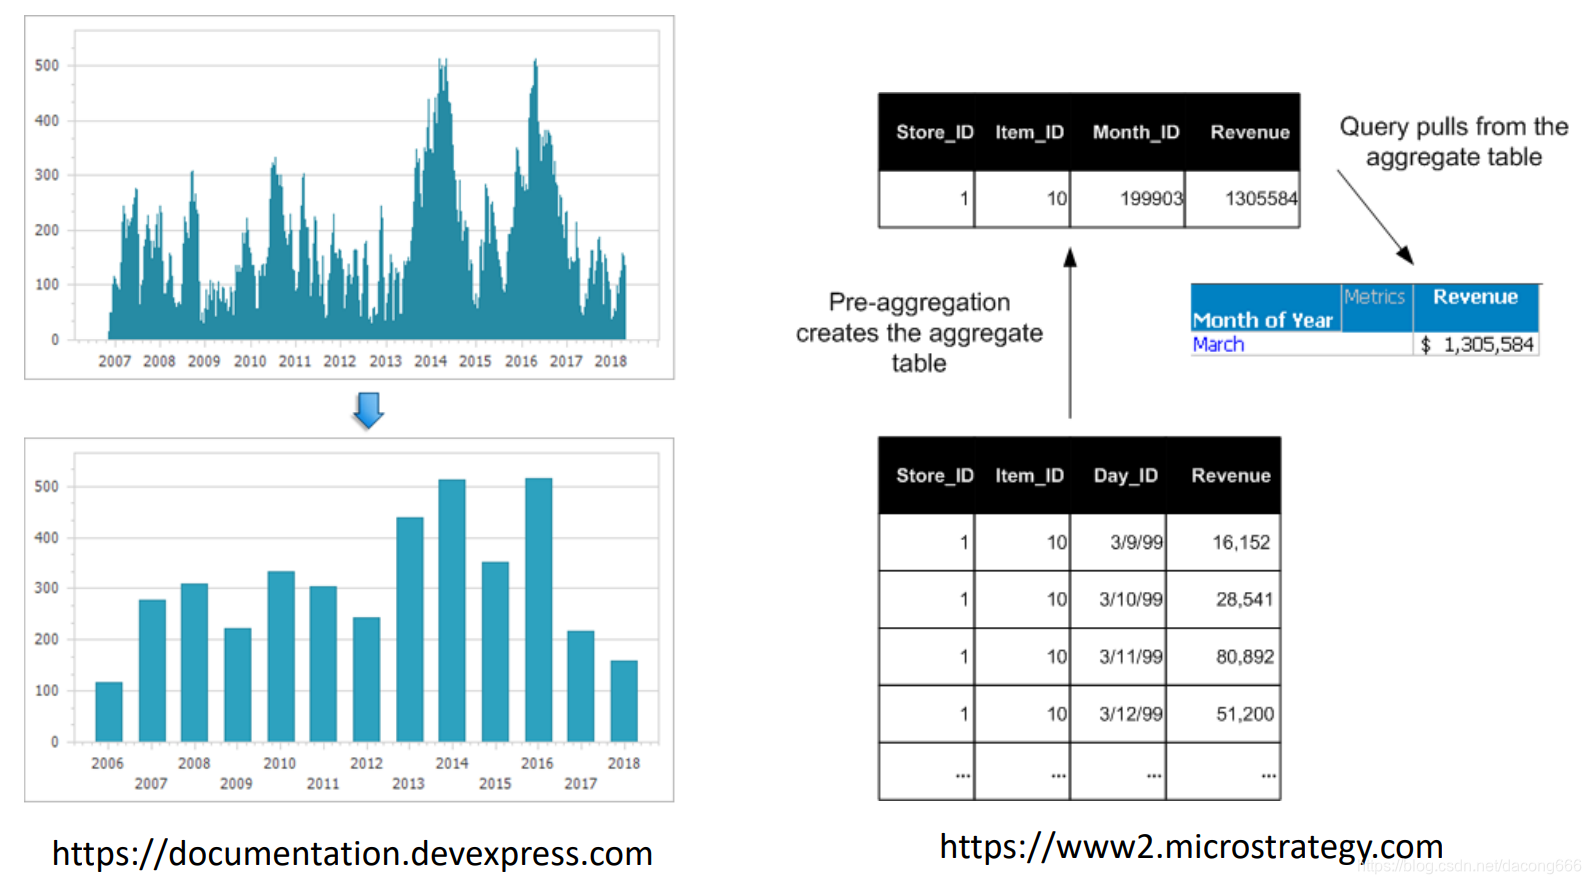
Aggregation
-
Combining two or more deatures (or observtions) into a single feature (or observation)
-
- Purpose
- Data reduction
Reduce the no. of features or observations - Change of scale
e.g. Cities aggregated into regions, states, countries, etc.
e.g. Days aggregated into weeks, months, or years. - More “stable” data
Aggregated data tends to have less variability
- Data reduction
- Purpose
-
 Sampling
-
Sampling is the main technique employed for data reduction. --> often used for both the preliminary investigation of the data and the final data analysis.
-
- Why use data sampling?
-
Expensive or time-cnsuming to obtain/collect entire set of relevant data
e.g. Random surbey instead of census on entire population
-
Expensive or time-consuming to process entire set to relevant data
(Less of an issue these days with distributed computing)
-
- Why use data sampling?
-
- Key principle for effective sampling:
- Using a sample will work almost as well as using the entire data set, if the sample is representative
- A sample is representative if it hass approximately the same properties (of interest) as the original set of data.
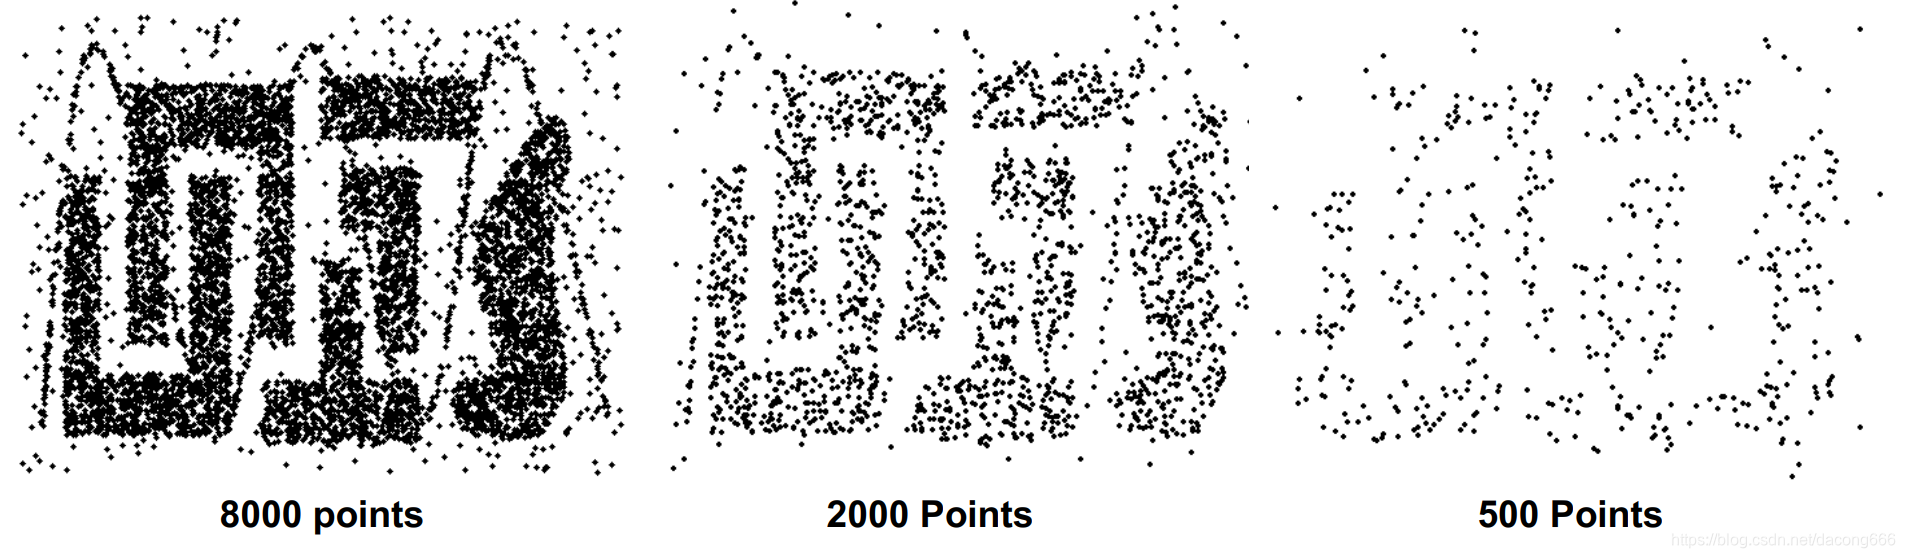
- Key principle for effective sampling:
-
- Types of Sampling
-
Simple Random Sampling
There is an equal probability of selecting any particular item.Sampling without replacement:
As each irem is selected, it is removed from the population.Sampling with replacement:
Objects are not removed from the population as they are selected for the sample. --> The same object can be picked up more than once. -
Strtified sampling
Split the data into several partitions; then draw random samples from each partition.
-
- Types of Sampling
 最低0.47元/天 解锁文章


 被折叠的 条评论
为什么被折叠?
被折叠的 条评论
为什么被折叠?
 到【灌水乐园】发言


