


摘要
随着智慧城市建设的快速发展,大数据可视化展板已成为城市管理、交通监控、金融风控等领域的重要工具。本文将从零开始,详细介绍如何构建一个功能完整的大数据可视化展板系统,涵盖前端技术选型、数据处理、图表设计、交互实现等核心内容。通过实际案例分析和代码示例,帮助开发者快速掌握大数据可视化展板的开发技能。
关键词: 大数据可视化、智慧城市、ECharts、数据大屏、前端开发
目录
1. 引言
在数字化转型的浪潮中,大数据可视化展板已成为企业和政府部门进行数据分析、决策支持的重要工具。一个优秀的数据大屏不仅能够直观地展示海量数据,还能通过交互式设计帮助用户深入挖掘数据价值。
本文将基于实际项目经验,为读者提供一套完整的大数据可视化展板开发方案,从基础概念到高级应用,帮助开发者构建专业级的数据可视化系统。
1.1 学习目标
通过本文学习,读者将能够:
- 理解大数据可视化展板的设计原理和技术架构
- 掌握基于HTML5、CSS3、JavaScript的前端开发技能
- 学会使用ECharts等可视化库创建各类图表
- 实现响应式设计和多屏适配
- 掌握数据处理和实时更新技术
- 了解性能优化和用户体验提升方法
1.2 适用读者
- 前端开发工程师
- 数据可视化开发者
- 智慧城市项目开发人员
- 对大数据可视化感兴趣的技术人员
2. 大数据可视化展板概述
2.1 什么是大数据可视化展板
大数据可视化展板(Data Visualization Dashboard)是一种将复杂数据通过图形化方式展示的交互式界面系统。它通过各种图表、地图、仪表盘等可视化组件,将抽象的数据转化为直观易懂的视觉信息。
2.2 应用场景
大数据可视化展板广泛应用于以下场景:
2.2.1 智慧城市管理
- 交通监控:实时显示城市交通流量、拥堵情况、事故分布
- 环境监测:空气质量、噪音水平、污染源分布
- 公共安全:视频监控、警情分布、应急响应
2.2.2 企业运营管理
- 销售分析:销售额趋势、区域分布、产品排行
- 生产监控:设备状态、产能分析、质量控制
- 财务管理:收支分析、成本控制、利润预测
2.2.3 金融风控
- 风险监控:实时风险指标、异常交易检测
- 信贷分析:贷款分布、逾期率、回收率
- 市场分析:股价走势、交易量、市场情绪
2.3 核心特征
优秀的大数据可视化展板应具备以下特征:
| 特征 | 描述 | 重要性 |
|---|---|---|
| 实时性 | 数据更新及时,反映最新状态 | ⭐⭐⭐⭐⭐ |
| 直观性 | 图表清晰,信息传达准确 | ⭐⭐⭐⭐⭐ |
| 交互性 | 支持用户操作,深度探索数据 | ⭐⭐⭐⭐ |
| 响应式 | 适配不同屏幕尺寸和设备 | ⭐⭐⭐⭐ |
| 美观性 | 界面设计美观,用户体验良好 | ⭐⭐⭐ |
3. 技术架构设计
3.1 整体架构
大数据可视化展板的技术架构通常采用前后端分离的设计模式:
3.2 前端技术栈
3.2.1 核心技术
# 前端技术栈配置示例
frontend_stack = {
    "基础技术": {
        "HTML5": "页面结构和语义化标记",
        "CSS3": "样式设计和动画效果",
        "JavaScript": "交互逻辑和数据处理",
        "ES6+": "现代JavaScript语法特性"
    },
    "可视化库": {
        "ECharts": "百度开源的可视化图表库",
        "D3.js": "数据驱动的文档操作库",
        "Chart.js": "轻量级图表库",
        "Three.js": "3D可视化库"
    },
    "UI框架": {
        "Bootstrap": "响应式CSS框架",
        "Element UI": "Vue.js组件库",
        "Ant Design": "React组件库"
    },
    "工具库": {
        "jQuery": "DOM操作和事件处理",
        "Lodash": "实用工具函数库",
        "Moment.js": "日期时间处理",
        "Axios": "HTTP请求库"
    }
}

# 打印技术栈信息
for category, technologies in frontend_stack.items():
    print(f"\n{category}:")
    for tech, description in technologies.items():
        print(f"  - {tech}: {description}")
3.2.2 项目结构
project/
├── index.html              # 主页面
├── css/                    # 样式文件
│   ├── common.css         # 公共样式
│   ├── layout.css         # 布局样式
│   └── components.css     # 组件样式
├── js/                    # JavaScript文件
│   ├── main.js           # 主逻辑
│   ├── charts.js         # 图表配置
│   ├── data.js           # 数据处理
│   └── utils.js          # 工具函数
├── images/               # 图片资源
├── fonts/                # 字体文件
├── data/                 # 静态数据
└── libs/                 # 第三方库
    ├── echarts.min.js
    ├── jquery.min.js
    └── bootstrap.min.css
3.3 数据流设计
4. 开发环境搭建
4.1 基础环境准备
4.1.1 开发工具安装
# 开发环境配置清单
development_tools = {
    "代码编辑器": [
        "Visual Studio Code",
        "WebStorm",
        "Sublime Text",
        "Atom"
    ],
    "浏览器": [
        "Chrome (推荐)",
        "Firefox",
        "Safari",
        "Edge"
    ],
    "版本控制": [
        "Git",
        "GitHub/GitLab"
    ],
    "包管理器": [
        "npm",
        "yarn",
        "pnpm"
    ],
    "构建工具": [
        "Webpack",
        "Vite",
        "Parcel",
        "Rollup"
    ]
}

# 推荐的VS Code插件
vscode_extensions = [
    "Live Server",           # 本地服务器
    "Prettier",             # 代码格式化
    "ESLint",               # 代码检查
    "Auto Rename Tag",      # 标签重命名
    "Bracket Pair Colorizer", # 括号配对
    "GitLens",              # Git增强
    "Thunder Client"        # API测试
]

print("推荐的开发工具配置:")
for category, tools in development_tools.items():
    print(f"\n{category}:")
    for tool in tools:
        print(f"  - {tool}")

print(f"\n推荐的VS Code插件:")
for ext in vscode_extensions:
    print(f"  - {ext}")
4.1.2 项目初始化
# 创建项目目录
mkdir data-visualization-dashboard
cd data-visualization-dashboard

# 初始化Git仓库
git init

# 创建基础目录结构
mkdir -p css js images fonts data libs

# 创建基础文件
touch index.html
touch css/style.css
touch js/main.js
touch README.md
4.2 依赖库引入
4.2.1 CDN方式引入
<!DOCTYPE html>
<html lang="zh-CN">
<head>
    <meta charset="UTF-8">
    <meta name="viewport" content="width=device-width, initial-scale=1.0">
    <title>大数据可视化展板</title>

    <!-- Bootstrap CSS -->
    <link href="https://cdn.jsdelivr.net/npm/bootstrap@5.1.3/dist/css/bootstrap.min.css" rel="stylesheet">

    <!-- 自定义样式 -->
    <link rel="stylesheet" href="css/style.css">
</head>
<body>
    <!-- 页面内容 -->

    <!-- jQuery -->
    <script src="https://cdn.jsdelivr.net/npm/jquery@3.6.0/dist/jquery.min.js"></script>

    <!-- Bootstrap JS -->
    <script src="https://cdn.jsdelivr.net/npm/bootstrap@5.1.3/dist/js/bootstrap.bundle.min.js"></script>

    <!-- ECharts -->
    <script src="https://cdn.jsdelivr.net/npm/echarts@5.4.0/dist/echarts.min.js"></script>

    <!-- 自定义脚本 -->
    <script src="js/main.js"></script>
</body>
</html>
4.2.2 本地文件引入
# 下载依赖库的Python脚本
import requests
import os

def download_library(url, filename):
    """下载JavaScript库文件"""
    try:
        response = requests.get(url)
        response.raise_for_status()

        # 确保目录存在
        os.makedirs(os.path.dirname(filename), exist_ok=True)

        # 写入文件
        with open(filename, 'w', encoding='utf-8') as f:
            f.write(response.text)

        print(f"✅ 成功下载: {filename}")

    except requests.RequestException as e:
        print(f"❌ 下载失败 {filename}: {e}")

# 需要下载的库文件
libraries = {
    "libs/jquery.min.js": "https://cdn.jsdelivr.net/npm/jquery@3.6.0/dist/jquery.min.js",
    "libs/echarts.min.js": "https://cdn.jsdelivr.net/npm/echarts@5.4.0/dist/echarts.min.js",
    "libs/bootstrap.min.css": "https://cdn.jsdelivr.net/npm/bootstrap@5.1.3/dist/css/bootstrap.min.css",
    "libs/bootstrap.min.js": "https://cdn.jsdelivr.net/npm/bootstrap@5.1.3/dist/js/bootstrap.bundle.min.js"
}

print("开始下载依赖库...")
for filename, url in libraries.items():
    download_library(url, filename)

print("\n依赖库下载完成!")
5. 核心功能实现
5.1 页面布局设计
5.1.1 响应式网格布局
<!DOCTYPE html>
<html lang="zh-CN">
<head>
    <meta charset="UTF-8">
    <meta name="viewport" content="width=device-width, initial-scale=1.0">
    <title>智慧城市数据大屏</title>
    <link rel="stylesheet" href="css/style.css">
</head>
<body>
    <!-- 页面头部 -->
    <header class="dashboard-header">
        <div class="container-fluid">
            <h1 class="title">智慧城市大数据可视化平台</h1>
            <div class="datetime" id="datetime"></div>
        </div>
    </header>

    <!-- 主要内容区域 -->
    <main class="dashboard-main">
        <div class="container-fluid">
            <div class="row">
                <!-- 左侧面板 -->
                <div class="col-lg-3 col-md-4">
                    <div class="panel-group">
                        <!-- 统计卡片 -->
                        <div class="stat-card">
                            <div class="stat-header">实时数据统计</div>
                            <div class="stat-body">
                                <div class="stat-item">
                                    <span class="stat-label">在线设备</span>
                                    <span class="stat-value" id="onlineDevices">1,234</span>
                                </div>
                                <div class="stat-item">
                                    <span class="stat-label">告警数量</span>
                                    <span class="stat-value alert" id="alertCount">56</span>
                                </div>
                            </div>
                        </div>

                        <!-- 图表面板 -->
                        <div class="chart-panel">
                            <div class="panel-header">设备状态分布</div>
                            <div class="panel-body">
                                <div id="deviceStatusChart" class="chart-container"></div>
                            </div>
                        </div>
                    </div>
                </div>

                <!-- 中间地图区域 -->
                <div class="col-lg-6 col-md-8">
                    <div class="map-panel">
                        <div class="panel-header">
                            <span>城市监控地图</span>
                            <div class="map-controls">
                                <button class="btn btn-sm" onclick="zoomIn()">放大</button>
                                <button class="btn btn-sm" onclick="zoomOut()">缩小</button>
                                <button class="btn btn-sm" onclick="resetView()">重置</button>
                            </div>
                        </div>
                        <div class="panel-body">
                            <div id="cityMap" class="map-container"></div>
                        </div>
                    </div>
                </div>

                <!-- 右侧面板 -->
                <div class="col-lg-3 col-md-12">
                    <div class="panel-group">
                        <!-- 趋势图表 -->
                        <div class="chart-panel">
                            <div class="panel-header">数据趋势分析</div>
                            <div class="panel-body">
                                <div id="trendChart" class="chart-container"></div>
                            </div>
                        </div>

                        <!-- 排行榜 -->
                        <div class="ranking-panel">
                            <div class="panel-header">区域排行榜</div>
                            <div class="panel-body">
                                <div class="ranking-list" id="rankingList">
                                    <!-- 动态生成排行榜内容 -->
                                </div>
                            </div>
                        </div>
                    </div>
                </div>
            </div>
        </div>
    </main>

    <!-- 脚本引入 -->
    <script src="libs/jquery.min.js"></script>
    <script src="libs/echarts.min.js"></script>
    <script src="js/main.js"></script>
</body>
</html>
5.1.2 CSS样式设计
/* 全局样式重置 */
* {
    margin: 0;
    padding: 0;
    box-sizing: border-box;
}

body {
    font-family: 'Microsoft YaHei', Arial, sans-serif;
    background: linear-gradient(135deg, #0c1426 0%, #1a2332 100%);
    color: #ffffff;
    overflow-x: hidden;
}

/* 页面头部样式 */
.dashboard-header {
    background: rgba(0, 0, 0, 0.3);
    backdrop-filter: blur(10px);
    border-bottom: 1px solid rgba(255, 255, 255, 0.1);
    padding: 15px 0;
    position: sticky;
    top: 0;
    z-index: 1000;
}

.dashboard-header .title {
    font-size: 28px;
    font-weight: 300;
    text-align: center;
    background: linear-gradient(45deg, #00d4ff, #00ff88);
    -webkit-background-clip: text;
    -webkit-text-fill-color: transparent;
    margin: 0;
}

.datetime {
    position: absolute;
    right: 30px;
    top: 50%;
    transform: translateY(-50%);
    font-size: 16px;
    color: #a0a0a0;
}

/* 主要内容区域 */
.dashboard-main {
    padding: 20px 0;
    min-height: calc(100vh - 80px);
}

/* 面板通用样式 */
.panel-group {
    display: flex;
    flex-direction: column;
    gap: 20px;
}

.stat-card,
.chart-panel,
.map-panel,
.ranking-panel {
    background: rgba(255, 255, 255, 0.05);
    border: 1px solid rgba(255, 255, 255, 0.1);
    border-radius: 12px;
    backdrop-filter: blur(10px);
    overflow: hidden;
    transition: all 0.3s ease;
}

.stat-card:hover,
.chart-panel:hover,
.map-panel:hover,
.ranking-panel:hover {
    border-color: rgba(0, 212, 255, 0.5);
    box-shadow: 0 8px 32px rgba(0, 212, 255, 0.1);
}

/* 面板头部 */
.panel-header,
.stat-header {
    background: rgba(0, 0, 0, 0.2);
    padding: 15px 20px;
    border-bottom: 1px solid rgba(255, 255, 255, 0.1);
    font-size: 16px;
    font-weight: 500;
    display: flex;
    justify-content: space-between;
    align-items: center;
}

/* 面板内容 */
.panel-body,
.stat-body {
    padding: 20px;
}

/* 统计卡片样式 */
.stat-item {
    display: flex;
    justify-content: space-between;
    align-items: center;
    padding: 12px 0;
    border-bottom: 1px solid rgba(255, 255, 255, 0.05);
}

.stat-item:last-child {
    border-bottom: none;
}

.stat-label {
    color: #a0a0a0;
    font-size: 14px;
}

.stat-value {
    font-size: 24px;
    font-weight: 600;
    color: #00ff88;
}

.stat-value.alert {
    color: #ff4757;
}

/* 图表容器 */
.chart-container {
    width: 100%;
    height: 300px;
}

.map-container {
    width: 100%;
    height: 500px;
    background: #1a2332;
    border-radius: 8px;
}

/* 地图控制按钮 */
.map-controls {
    display: flex;
    gap: 8px;
}

.btn {
    background: rgba(0, 212, 255, 0.2);
    border: 1px solid rgba(0, 212, 255, 0.5);
    color: #00d4ff;
    padding: 6px 12px;
    border-radius: 6px;
    cursor: pointer;
    transition: all 0.3s ease;
}

.btn:hover {
    background: rgba(0, 212, 255, 0.3);
    border-color: #00d4ff;
}

/* 排行榜样式 */
.ranking-list {
    max-height: 300px;
    overflow-y: auto;
}

.ranking-item {
    display: flex;
    justify-content: space-between;
    align-items: center;
    padding: 12px 0;
    border-bottom: 1px solid rgba(255, 255, 255, 0.05);
}

.ranking-item:last-child {
    border-bottom: none;
}

.ranking-rank {
    width: 30px;
    height: 30px;
    border-radius: 50%;
    background: linear-gradient(45deg, #00d4ff, #00ff88);
    display: flex;
    align-items: center;
    justify-content: center;
    font-weight: 600;
    font-size: 14px;
    color: #000;
}

.ranking-name {
    flex: 1;
    margin-left: 15px;
    color: #ffffff;
}

.ranking-value {
    color: #00ff88;
    font-weight: 600;
}

/* 响应式设计 */
@media (max-width: 768px) {
    .dashboard-header .title {
        font-size: 20px;
    }

    .datetime {
        position: static;
        text-align: center;
        margin-top: 10px;
        transform: none;
    }

    .panel-group {
        gap: 15px;
    }

    .chart-container {
        height: 250px;
    }

    .map-container {
        height: 400px;
    }
}

/* 滚动条样式 */
::-webkit-scrollbar {
    width: 6px;
}

::-webkit-scrollbar-track {
    background: rgba(255, 255, 255, 0.1);
}

::-webkit-scrollbar-thumb {
    background: rgba(0, 212, 255, 0.5);
    border-radius: 3px;
}

::-webkit-scrollbar-thumb:hover {
    background: rgba(0, 212, 255, 0.7);
}

/* 动画效果 */
@keyframes fadeInUp {
    from {
        opacity: 0;
        transform: translateY(30px);
    }
    to {
        opacity: 1;
        transform: translateY(0);
    }
}

.stat-card,
.chart-panel,
.map-panel,
.ranking-panel {
    animation: fadeInUp 0.6s ease-out;
}
5.2 数据处理模块
5.2.1 数据获取与处理
/**
 * 数据处理工具类
 */
class DataProcessor {
    constructor() {
        this.cache = new Map();
        this.updateInterval = 30000; // 30秒更新间隔
    }

    /**
     * 获取数据的通用方法
     * @param {string} url - API地址
     * @param {Object} options - 请求选项
     * @returns {Promise} 返回处理后的数据
     */
    async fetchData(url, options = {}) {
        try {
            // 检查缓存
            const cacheKey = `${url}_${JSON.stringify(options)}`;
            if (this.cache.has(cacheKey)) {
                const cached = this.cache.get(cacheKey);
                if (Date.now() - cached.timestamp < this.updateInterval) {
                    return cached.data;
                }
            }

            // 发起请求
            const response = await fetch(url, {
                method: 'GET',
                headers: {
                    'Content-Type': 'application/json',
                    ...options.headers
                },
                ...options
            });

            if (!response.ok) {
                throw new Error(`HTTP error! status: ${response.status}`);
            }

            const data = await response.json();

            // 数据验证和处理
            const processedData = this.validateAndProcess(data);

            // 更新缓存
            this.cache.set(cacheKey, {
                data: processedData,
                timestamp: Date.now()
            });

            return processedData;

        } catch (error) {
            console.error('数据获取失败:', error);
            // 返回模拟数据作为降级方案
            return this.getMockData(url);
        }
    }

    /**
     * 数据验证和处理
     * @param {Object} data - 原始数据
     * @returns {Object} 处理后的数据
     */
    validateAndProcess(data) {
        if (!data || typeof data !== 'object') {
            throw new Error('无效的数据格式');
        }

        // 数据清洗:移除空值和异常值
        const cleanData = this.cleanData(data);

        // 数据转换:统一格式
        const transformedData = this.transformData(cleanData);

        // 数据聚合:计算统计指标
        const aggregatedData = this.aggregateData(transformedData);

        return aggregatedData;
    }

    /**
     * 数据清洗
     * @param {Object} data - 原始数据
     * @returns {Object} 清洗后的数据
     */
    cleanData(data) {
        const cleaned = JSON.parse(JSON.stringify(data));

        // 递归清理对象
        const cleanObject = (obj) => {
            for (let key in obj) {
                if (obj[key] === null || obj[key] === undefined || obj[key] === '') {
                    delete obj[key];
                } else if (typeof obj[key] === 'object' && !Array.isArray(obj[key])) {
                    cleanObject(obj[key]);
                } else if (Array.isArray(obj[key])) {
                    obj[key] = obj[key].filter(item =>
                        item !== null && item !== undefined && item !== ''
                    );
                }
            }
        };

        cleanObject(cleaned);
        return cleaned;
    }

    /**
     * 数据转换
     * @param {Object} data - 清洗后的数据
     * @returns {Object} 转换后的数据
     */
    transformData(data) {
        const transformed = { ...data };

        // 时间格式标准化
        if (transformed.timestamp) {
            transformed.formattedTime = new Date(transformed.timestamp).toLocaleString('zh-CN');
        }

        // 数值格式化
        if (transformed.statistics) {
            for (let key in transformed.statistics) {
                const value = transformed.statistics[key];
                if (typeof value === 'number') {
                    transformed.statistics[key] = {
                        raw: value,
                        formatted: this.formatNumber(value),
                        percentage: this.calculatePercentage(value, transformed.total || 100)
                    };
                }
            }
        }

        return transformed;
    }

    /**
     * 数据聚合
     * @param {Object} data - 转换后的数据
     * @returns {Object} 聚合后的数据
     */
    aggregateData(data) {
        const aggregated = { ...data };

        // 计算总计
        if (data.items && Array.isArray(data.items)) {
            aggregated.summary = {
                total: data.items.length,
                sum: data.items.reduce((sum, item) => sum + (item.value || 0), 0),
                average: data.items.reduce((sum, item) => sum + (item.value || 0), 0) / data.items.length,
                max: Math.max(...data.items.map(item => item.value || 0)),
                min: Math.min(...data.items.map(item => item.value || 0))
            };
        }

        return aggregated;
    }

    /**
     * 数字格式化
     * @param {number} num - 数字
     * @returns {string} 格式化后的字符串
     */
    formatNumber(num) {
        if (num >= 1000000) {
            return (num / 1000000).toFixed(1) + 'M';
        } else if (num >= 1000) {
            return (num / 1000).toFixed(1) + 'K';
        }
        return num.toString();
    }

    /**
     * 计算百分比
     * @param {number} value - 当前值
     * @param {number} total - 总值
     * @returns {string} 百分比字符串
     */
    calculatePercentage(value, total) {
        if (total === 0) return '0%';
        return ((value / total) * 100).toFixed(1) + '%';
    }

    /**
     * 获取模拟数据
     * @param {string} url - API地址
     * @returns {Object} 模拟数据
     */
    getMockData(url) {
        const mockDataMap = {
            '/api/statistics': {
                onlineDevices: 1234,
                alertCount: 56,
                totalUsers: 8765,
                systemLoad: 78.5,
                timestamp: Date.now()
            },
            '/api/device-status': {
                online: 85,
                offline: 12,
                maintenance: 3,
                total: 100
            },
            '/api/trend-data': {
                dates: ['01-01', '01-02', '01-03', '01-04', '01-05', '01-06', '01-07'],
                values: [120, 132, 101, 134, 90, 230, 210]
            },
            '/api/ranking': [
                { name: '朝阳区', value: 2345 },
                { name: '海淀区', value: 2156 },
                { name: '西城区', value: 1987 },
                { name: '东城区', value: 1876 },
                { name: '丰台区', value: 1654 }
            ]
        };

        return mockDataMap[url] || { error: '未找到模拟数据' };
    }

    /**
     * 清除缓存
     */
    clearCache() {
        this.cache.clear();
    }
}

// 创建全局数据处理器实例
const dataProcessor = new DataProcessor();
5.2.2 实时数据更新
/**
 * 实时数据更新管理器
 */
class RealTimeUpdater {
    constructor() {
        this.updateTasks = new Map();
        this.isRunning = false;
        this.defaultInterval = 30000; // 默认30秒更新间隔
    }

    /**
     * 注册更新任务
     * @param {string} taskId - 任务ID
     * @param {Function} updateFunction - 更新函数
     * @param {number} interval - 更新间隔(毫秒)
     */
    registerTask(taskId, updateFunction, interval = this.defaultInterval) {
        this.updateTasks.set(taskId, {
            function: updateFunction,
            interval: interval,
            lastUpdate: 0,
            isActive: true
        });

        console.log(`✅ 注册更新任务: ${taskId}, 间隔: ${interval}ms`);
    }

    /**
     * 启动实时更新
     */
    start() {
        if (this.isRunning) {
            console.warn('实时更新已在运行中');
            return;
        }

        this.isRunning = true;
        console.log('🚀 启动实时数据更新');

        // 立即执行一次所有任务
        this.executeAllTasks();

        // 设置定时器
        this.timer = setInterval(() => {
            this.executeAllTasks();
        }, 1000); // 每秒检查一次
    }

    /**
     * 停止实时更新
     */
    stop() {
        if (!this.isRunning) {
            console.warn('实时更新未在运行');
            return;
        }

        this.isRunning = false;
        if (this.timer) {
            clearInterval(this.timer);
            this.timer = null;
        }

        console.log('⏹️ 停止实时数据更新');
    }

    /**
     * 执行所有更新任务
     */
    async executeAllTasks() {
        const now = Date.now();

        for (const [taskId, task] of this.updateTasks) {
            if (!task.isActive) continue;

            // 检查是否到了更新时间
            if (now - task.lastUpdate >= task.interval) {
                try {
                    await task.function();
                    task.lastUpdate = now;
                    console.log(`🔄 更新任务执行成功: ${taskId}`);
                } catch (error) {
                    console.error(`❌ 更新任务执行失败: ${taskId}`, error);
                }
            }
        }
    }

    /**
     * 暂停指定任务
     * @param {string} taskId - 任务ID
     */
    pauseTask(taskId) {
        const task = this.updateTasks.get(taskId);
        if (task) {
            task.isActive = false;
            console.log(`⏸️ 暂停更新任务: ${taskId}`);
        }
    }

    /**
     * 恢复指定任务
     * @param {string} taskId - 任务ID
     */
    resumeTask(taskId) {
        const task = this.updateTasks.get(taskId);
        if (task) {
            task.isActive = true;
            console.log(`▶️ 恢复更新任务: ${taskId}`);
        }
    }

    /**
     * 移除指定任务
     * @param {string} taskId - 任务ID
     */
    removeTask(taskId) {
        if (this.updateTasks.delete(taskId)) {
            console.log(`🗑️ 移除更新任务: ${taskId}`);
        }
    }

    /**
     * 获取任务状态
     * @returns {Object} 任务状态信息
     */
    getStatus() {
        const tasks = Array.from(this.updateTasks.entries()).map(([id, task]) => ({
            id,
            interval: task.interval,
            lastUpdate: task.lastUpdate,
            isActive: task.isActive,
            nextUpdate: task.lastUpdate + task.interval
        }));

        return {
            isRunning: this.isRunning,
            taskCount: this.updateTasks.size,
            tasks
        };
    }
}

// 创建全局实时更新器实例
const realTimeUpdater = new RealTimeUpdater();

// 页面卸载时停止更新
window.addEventListener('beforeunload', () => {
    realTimeUpdater.stop();
});

// 页面可见性变化时控制更新
document.addEventListener('visibilitychange', () => {
    if (document.hidden) {
        realTimeUpdater.stop();
    } else {
        realTimeUpdater.start();
    }
});
6. 数据处理与可视化
6.1 ECharts图表实现
6.1.1 基础图表配置
/**
* 图表管理器
*/
class ChartManager {
constructor() {
this.charts = new Map();
this.defaultTheme = 'dark';
this.commonOptions = this.getCommonOptions();
}
/**
* 获取通用配置选项
* @returns {Object} 通用配置
*/
getCommonOptions() {
return {
backgroundColor: 'transparent',
textStyle: {
color: '#ffffff',
fontFamily: 'Microsoft YaHei'
},
tooltip: {
backgroundColor: 'rgba(0, 0, 0, 0.8)',
borderColor: 'rgba(0, 212, 255, 0.5)',
borderWidth: 1,
textStyle: {
color: '#ffffff'
}
},
legend: {
textStyle: {
color: '#ffffff'
}
},
grid: {
left: '3%',
right: '4%',
bottom: '3%',
containLabel: true
}
};
}
/**
* 创建饼图
* @param {string} containerId - 容器ID
* @param {Array} data - 数据数组
* @param {Object} options - 自定义选项
*/
createPieChart(containerId, data, options = {}) {
const container = document.getElementById(containerId);
if (!container) {
console.error(`容器不存在: ${containerId}`);
return null;
}
const chart = echarts.init(container);
const defaultOptions = {
...this.commonOptions,
title: {
text: options.title || '数据分布',
left: 'center',
textStyle: {
color: '#ffffff',
fontSize: 16
}
},
tooltip: {
...this.commonOptions.tooltip,
trigger: 'item',
formatter: '{a} <br/>{b}: {c} ({d}%)'
},
legend: {
...this.commonOptions.legend,
orient: 'vertical',
left: 'left'
},
series: [{
name: options.seriesName || '数据',
type: 'pie',
radius: ['40%', '70%'],
center: ['60%', '50%'],
avoidLabelOverlap: false,
itemStyle: {
borderRadius: 8,
borderColor: '#fff',
borderWidth: 2
},
label: {
show: false,
position: 'center'
},
emphasis: {
label: {
show: true,
fontSize: '18',
fontWeight: 'bold'
}
},
labelLine: {
show: false
},
data: data.map((item, index) => ({
...item,
itemStyle: {
color: this.getColorByIndex(index)
}
}))
}]
};
chart.setOption(defaultOptions);
this.charts.set(containerId, chart);
// 添加点击事件
chart.on('click', (params) => {
console.log('饼图点击事件:', params);
if (options.onClick) {
options.onClick(params);
}
});
return chart;
}
/**
* 创建折线图
* @param {string} containerId - 容器ID
* @param {Object} data - 数据对象
* @param {Object} options - 自定义选项
*/
createLineChart(containerId, data, options = {}) {
const container = document.getElementById(containerId);
if (!container) {
console.error(`容器不存在: ${containerId}`);
return null;
}
const chart = echarts.init(container);
const defaultOptions = {
...this.commonOptions,
title: {
text: options.title || '趋势分析',
left: 'center',
textStyle: {
color: '#ffffff',
fontSize: 16
}
},
tooltip: {
...this.commonOptions.tooltip,
trigger: 'axis',
axisPointer: {
type: 'cross',
label: {
backgroundColor: '#6a7985'
}
}
},
xAxis: {
type: 'category',
boundaryGap: false,
data: data.categories || [],
axisLine: {
lineStyle: {
color: 'rgba(255, 255, 255, 0.3)'
}
},
axisLabel: {
color: '#ffffff'
}
},
yAxis: {
type: 'value',
axisLine: {
lineStyle: {
color: 'rgba(255, 255, 255, 0.3)'
}
},
axisLabel: {
color: '#ffffff'
},
splitLine: {
lineStyle: {
color: 'rgba(255, 255, 255, 0.1)'
}
}
},
series: data.series ? data.series.map((series, index) => ({
name: series.name,
type: 'line',
smooth: true,
symbol: 'circle',
symbolSize: 6,
lineStyle: {
width: 3,
color: this.getColorByIndex(index)
},
itemStyle: {
color: this.getColorByIndex(index)
},
areaStyle: {
color: {
type: 'linear',
x: 0,
y: 0,
x2: 0,
y2: 1,
colorStops: [{
offset: 0,
color: this.getColorByIndex(index, 0.3)
}, {
offset: 1,
color: this.getColorByIndex(index, 0.05)
}]
}
},
data: series.data || []
})) : []
};
chart.setOption(defaultOptions);
this.charts.set(containerId, chart);
return chart;
}
/**
* 创建柱状图
* @param {string} containerId - 容器ID
* @param {Object} data - 数据对象
* @param {Object} options - 自定义选项
*/
createBarChart(containerId, data, options = {}) {
const container = document.getElementById(containerId);
if (!container) {
console.error(`容器不存在: ${containerId}`);
return null;
}
const chart = echarts.init(container);
const defaultOptions = {
...this.commonOptions,
title: {
text: options.title || '数据对比',
left: 'center',
textStyle: {
color: '#ffffff',
fontSize: 16
}
},
tooltip: {
...this.commonOptions.tooltip,
trigger: 'axis',
axisPointer: {
type: 'shadow'
}
},
xAxis: {
type: 'category',
data: data.categories || [],
axisLine: {
lineStyle: {
color: 'rgba(255, 255, 255, 0.3)'
}
},
axisLabel: {
color: '#ffffff',
rotate: options.rotateLabel ? 45 : 0
}
},
yAxis: {
type: 'value',
axisLine: {
lineStyle: {
color: 'rgba(255, 255, 255, 0.3)'
}
},
axisLabel: {
color: '#ffffff'
},
splitLine: {
lineStyle: {
color: 'rgba(255, 255, 255, 0.1)'
}
}
},
series: data.series ? data.series.map((series, index) => ({
name: series.name,
type: 'bar',
barWidth: '60%',
itemStyle: {
color: {
type: 'linear',
x: 0,
y: 0,
x2: 0,
y2: 1,
colorStops: [{
offset: 0,
color: this.getColorByIndex(index, 0.8)
}, {
offset: 1,
color: this.getColorByIndex(index, 0.3)
}]
},
borderRadius: [4, 4, 0, 0]
},
data: series.data || []
})) : []
};
chart.setOption(defaultOptions);
this.charts.set(containerId, chart);
return chart;
}
/**
* 根据索引获取颜色
* @param {number} index - 索引
* @param {number} alpha - 透明度
* @returns {string} 颜色值
*/
getColorByIndex(index, alpha = 1) {
const colors = [
'#00d4ff',
'#00ff88',
'#ff6b6b',
'#ffd93d',
'#6c5ce7',
'#fd79a8',
'#fdcb6e',
'#e17055'
];
const color = colors[index % colors.length];
if (alpha < 1) {
// 转换为rgba格式
const hex = color.replace('#', '');
const r = parseInt(hex.substr(0, 2), 16);
const g = parseInt(hex.substr(2, 2), 16);
const b = parseInt(hex.substr(4, 2), 16);
return `rgba(${r}, ${g}, ${b}, ${alpha})`;
}
return color;
}
/**
* 更新图表数据
* @param {string} containerId - 容器ID
* @param {Object} newData - 新数据
*/
updateChart(containerId, newData) {
const chart = this.charts.get(containerId);
if (!chart) {
console.error(`图表不存在: ${containerId}`);
return;
}
const option = chart.getOption();
// 更新数据
if (newData.series) {
option.series = newData.series;
}
if (newData.categories) {
option.xAxis[0].data = newData.categories;
}
chart.setOption(option, true);
}
/**
* 调整图表大小
* @param {string} containerId - 容器ID(可选,不传则调整所有图表)
*/
resize(containerId = null) {
if (containerId) {
const chart = this.charts.get(containerId);
if (chart) {
chart.resize();
}
} else {
// 调整所有图表
this.charts.forEach(chart => {
chart.resize();
});
}
}
/**
* 销毁图表
* @param {string} containerId - 容器ID
*/
dispose(containerId) {
const chart = this.charts.get(containerId);
if (chart) {
chart.dispose();
this.charts.delete(containerId);
}
}
/**
* 销毁所有图表
*/
disposeAll() {
this.charts.forEach(chart => {
chart.dispose();
});
this.charts.clear();
}
}
// 创建全局图表管理器实例
const chartManager = new ChartManager();
// 窗口大小变化时调整图表
window.addEventListener('resize', () => {
chartManager.resize();
});
6.1.2 地图可视化实现
/**
 * 地图可视化管理器
 */
class MapManager {
    constructor() {
        this.map = null;
        this.markers = [];
        this.heatmapData = [];
        this.currentView = 'normal';
    }

    /**
     * 初始化地图
     * @param {string} containerId - 地图容器ID
     * @param {Object} options - 地图配置选项
     */
    initMap(containerId, options = {}) {
        const container = document.getElementById(containerId);
        if (!container) {
            console.error(`地图容器不存在: ${containerId}`);
            return;
        }

        // 使用ECharts地图
        this.map = echarts.init(container);

        const defaultOptions = {
            backgroundColor: 'transparent',
            geo: {
                map: 'china',
                roam: true,
                zoom: 1.2,
                center: [104.114129, 37.550339],
                itemStyle: {
                    areaColor: 'rgba(0, 212, 255, 0.1)',
                    borderColor: 'rgba(0, 212, 255, 0.5)',
                    borderWidth: 1
                },
                emphasis: {
                    itemStyle: {
                        areaColor: 'rgba(0, 212, 255, 0.3)'
                    }
                },
                label: {
                    show: true,
                    color: '#ffffff',
                    fontSize: 12
                }
            },
            series: []
        };

        this.map.setOption(defaultOptions);

        // 添加地图事件
        this.map.on('click', (params) => {
            console.log('地图点击事件:', params);
            if (options.onClick) {
                options.onClick(params);
            }
        });

        console.log('✅ 地图初始化完成');
    }

    /**
     * 添加散点数据
     * @param {Array} data - 散点数据
     * @param {Object} options - 配置选项
     */
    addScatterData(data, options = {}) {
        if (!this.map) {
            console.error('地图未初始化');
            return;
        }

        const scatterSeries = {
            name: options.name || '散点数据',
            type: 'scatter',
            coordinateSystem: 'geo',
            data: data.map(item => ({
                name: item.name,
                value: [item.longitude, item.latitude, item.value],
                symbolSize: this.calculateSymbolSize(item.value, options.sizeRange),
                itemStyle: {
                    color: options.color || '#00ff88',
                    opacity: 0.8
                }
            })),
            symbolSize: function(val) {
                return Math.max(val[2] / 10, 8);
            },
            label: {
                show: false,
                formatter: '{b}',
                position: 'right'
            },
            emphasis: {
                label: {
                    show: true
                }
            }
        };

        const option = this.map.getOption();
        option.series.push(scatterSeries);
        this.map.setOption(option);
    }

    /**
     * 添加热力图数据
     * @param {Array} data - 热力图数据
     * @param {Object} options - 配置选项
     */
    addHeatmapData(data, options = {}) {
        if (!this.map) {
            console.error('地图未初始化');
            return;
        }

        const heatmapSeries = {
            name: options.name || '热力图',
            type: 'heatmap',
            coordinateSystem: 'geo',
            data: data.map(item => [
                item.longitude,
                item.latitude,
                item.value
            ]),
            pointSize: options.pointSize || 20,
            blurSize: options.blurSize || 30
        };

        const option = this.map.getOption();
        option.series.push(heatmapSeries);
        this.map.setOption(option);
    }

    /**
     * 添加路径数据
     * @param {Array} paths - 路径数据
     * @param {Object} options - 配置选项
     */
    addPathData(paths, options = {}) {
        if (!this.map) {
            console.error('地图未初始化');
            return;
        }

        const linesSeries = {
            name: options.name || '路径数据',
            type: 'lines',
            coordinateSystem: 'geo',
            data: paths.map(path => ({
                coords: path.coordinates,
                lineStyle: {
                    color: options.color || '#ff6b6b',
                    width: options.width || 2,
                    opacity: 0.8
                }
            })),
            effect: {
                show: true,
                period: 6,
                trailLength: 0.7,
                color: options.effectColor || '#ffffff',
                symbolSize: 3
            },
            lineStyle: {
                color: options.color || '#ff6b6b',
                width: 0,
                curveness: 0.2
            }
        };

        const option = this.map.getOption();
        option.series.push(linesSeries);
        this.map.setOption(option);
    }

    /**
     * 计算符号大小
     * @param {number} value - 数值
     * @param {Array} sizeRange - 大小范围 [min, max]
     * @returns {number} 符号大小
     */
    calculateSymbolSize(value, sizeRange = [8, 40]) {
        const [minSize, maxSize] = sizeRange;
        const normalizedValue = Math.min(Math.max(value / 100, 0), 1);
        return minSize + (maxSize - minSize) * normalizedValue;
    }

    /**
     * 切换地图视图
     * @param {string} viewType - 视图类型 ('normal', 'satellite', 'terrain')
     */
    switchView(viewType) {
        if (!this.map) {
            console.error('地图未初始化');
            return;
        }

        this.currentView = viewType;

        const option = this.map.getOption();

        switch (viewType) {
            case 'satellite':
                option.geo[0].itemStyle.areaColor = 'rgba(0, 0, 0, 0.3)';
                break;
            case 'terrain':
                option.geo[0].itemStyle.areaColor = 'rgba(139, 69, 19, 0.3)';
                break;
            default:
                option.geo[0].itemStyle.areaColor = 'rgba(0, 212, 255, 0.1)';
        }

        this.map.setOption(option);
        console.log(`🗺️ 切换到${viewType}视图`);
    }

    /**
     * 缩放到指定区域
     * @param {string} regionName - 区域名称
     */
    zoomToRegion(regionName) {
        if (!this.map) {
            console.error('地图未初始化');
            return;
        }

        // 这里可以根据区域名称设置不同的中心点和缩放级别
        const regionConfig = {
            '北京': { center: [116.4074, 39.9042], zoom: 8 },
            '上海': { center: [121.4737, 31.2304], zoom: 8 },
            '广州': { center: [113.2644, 23.1291], zoom: 8 },
            '深圳': { center: [114.0579, 22.5431], zoom: 8 }
        };

        const config = regionConfig[regionName];
        if (config) {
            const option = this.map.getOption();
            option.geo[0].center = config.center;
            option.geo[0].zoom = config.zoom;
            this.map.setOption(option);

            console.log(`🎯 缩放到${regionName}`);
        }
    }

    /**
     * 清除所有数据
     */
    clearData() {
        if (!this.map) {
            console.error('地图未初始化');
            return;
        }

        const option = this.map.getOption();
        option.series = [];
        this.map.setOption(option);

        this.markers = [];
        this.heatmapData = [];

        console.log('🧹 清除地图数据');
    }

    /**
     * 调整地图大小
     */
    resize() {
        if (this.map) {
            this.map.resize();
        }
    }

    /**
     * 销毁地图
     */
    dispose() {
        if (this.map) {
            this.map.dispose();
            this.map = null;
        }
    }
}

// 创建全局地图管理器实例
const mapManager = new MapManager();
7. 响应式设计与适配
7.1 多屏幕适配策略
7.1.1 CSS媒体查询
/* 响应式设计 - 移动端优先 */

/* 基础样式 - 适用于所有设备 */
.dashboard-container {
    width: 100%;
    min-height: 100vh;
    padding: 10px;
    box-sizing: border-box;
}

/* 小屏幕设备 (手机) - 最大宽度 576px */
@media (max-width: 576px) {
    .dashboard-header .title {
        font-size: 18px;
        padding: 10px 0;
    }

    .datetime {
        position: static;
        text-align: center;
        font-size: 14px;
        margin-top: 5px;
    }

    .panel-group {
        gap: 10px;
    }

    .chart-container {
        height: 200px;
    }

    .map-container {
        height: 300px;
    }

    .stat-item {
        flex-direction: column;
        text-align: center;
        gap: 5px;
    }

    .stat-value {
        font-size: 20px;
    }

    .map-controls {
        flex-wrap: wrap;
        gap: 5px;
    }

    .btn {
        padding: 4px 8px;
        font-size: 12px;
    }
}

/* 中等屏幕设备 (平板) - 576px 到 768px */
@media (min-width: 576px) and (max-width: 768px) {
    .dashboard-header .title {
        font-size: 22px;
    }

    .chart-container {
        height: 250px;
    }

    .map-container {
        height: 400px;
    }

    .panel-group {
        gap: 15px;
    }

    .stat-value {
        font-size: 22px;
    }
}

/* 大屏幕设备 (桌面) - 768px 到 992px */
@media (min-width: 768px) and (max-width: 992px) {
    .dashboard-header .title {
        font-size: 24px;
    }

    .chart-container {
        height: 280px;
    }

    .map-container {
        height: 450px;
    }

    .panel-group {
        gap: 18px;
    }
}

/* 超大屏幕设备 (大桌面) - 992px 到 1200px */
@media (min-width: 992px) and (max-width: 1200px) {
    .dashboard-header .title {
        font-size: 26px;
    }

    .chart-container {
        height: 300px;
    }

    .map-container {
        height: 500px;
    }
}

/* 超超大屏幕设备 - 大于 1200px */
@media (min-width: 1200px) {
    .dashboard-header .title {
        font-size: 28px;
    }

    .chart-container {
        height: 320px;
    }

    .map-container {
        height: 550px;
    }
}

/* 超宽屏幕 - 大于 1600px */
@media (min-width: 1600px) {
    .dashboard-container {
        max-width: 1600px;
        margin: 0 auto;
    }

    .chart-container {
        height: 350px;
    }

    .map-container {
        height: 600px;
    }
}

/* 横屏模式适配 */
@media (orientation: landscape) and (max-height: 600px) {
    .dashboard-header {
        padding: 8px 0;
    }

    .dashboard-header .title {
        font-size: 20px;
    }

    .chart-container {
        height: 180px;
    }

    .map-container {
        height: 250px;
    }

    .panel-group {
        gap: 8px;
    }
}

/* 高分辨率屏幕适配 */
@media (-webkit-min-device-pixel-ratio: 2), (min-resolution: 192dpi) {
    .dashboard-header .title {
        -webkit-font-smoothing: antialiased;
        -moz-osx-font-smoothing: grayscale;
    }

    .btn {
        border-width: 0.5px;
    }
}

/* 打印样式 */
@media print {
    .dashboard-header,
    .map-controls,
    .btn {
        display: none !important;
    }

    .dashboard-container {
        background: white !important;
        color: black !important;
    }

    .panel-group {
        break-inside: avoid;
    }
}
7.1.2 JavaScript响应式处理
/**
 * 响应式管理器
 */
class ResponsiveManager {
    constructor() {
        this.breakpoints = {
            xs: 576,
            sm: 768,
            md: 992,
            lg: 1200,
            xl: 1600
        };

        this.currentBreakpoint = this.getCurrentBreakpoint();
        this.resizeHandlers = [];
        this.orientationHandlers = [];

        this.init();
    }

    /**
     * 初始化响应式管理器
     */
    init() {
        // 监听窗口大小变化
        window.addEventListener('resize', this.debounce(() => {
            this.handleResize();
        }, 250));

        // 监听屏幕方向变化
        window.addEventListener('orientationchange', () => {
            setTimeout(() => {
                this.handleOrientationChange();
            }, 100);
        });

        // 初始化时执行一次
        this.handleResize();

        console.log('📱 响应式管理器初始化完成');
    }

    /**
     * 获取当前断点
     * @returns {string} 断点名称
     */
    getCurrentBreakpoint() {
        const width = window.innerWidth;

        if (width < this.breakpoints.xs) return 'xs';
        if (width < this.breakpoints.sm) return 'sm';
        if (width < this.breakpoints.md) return 'md';
        if (width < this.breakpoints.lg) return 'lg';
        if (width < this.breakpoints.xl) return 'xl';
        return 'xxl';
    }

    /**
     * 处理窗口大小变化
     */
    handleResize() {
        const newBreakpoint = this.getCurrentBreakpoint();
        const oldBreakpoint = this.currentBreakpoint;

        // 更新当前断点
        this.currentBreakpoint = newBreakpoint;

        // 更新CSS类
        this.updateBodyClasses();

        // 调整图表大小
        if (window.chartManager) {
            chartManager.resize();
        }

        // 调整地图大小
        if (window.mapManager) {
            mapManager.resize();
        }

        // 执行注册的处理函数
        this.resizeHandlers.forEach(handler => {
            try {
                handler({
                    width: window.innerWidth,
                    height: window.innerHeight,
                    breakpoint: newBreakpoint,
                    oldBreakpoint: oldBreakpoint,
                    isBreakpointChanged: newBreakpoint !== oldBreakpoint
                });
            } catch (error) {
                console.error('响应式处理函数执行错误:', error);
            }
        });

        console.log(`📐 窗口大小变化: ${window.innerWidth}x${window.innerHeight}, 断点: ${newBreakpoint}`);
    }

    /**
     * 处理屏幕方向变化
     */
    handleOrientationChange() {
        const orientation = this.getOrientation();

        // 更新CSS类
        this.updateBodyClasses();

        // 重新调整布局
        this.handleResize();

        // 执行注册的处理函数
        this.orientationHandlers.forEach(handler => {
            try {
                handler({
                    orientation: orientation,
                    width: window.innerWidth,
                    height: window.innerHeight
                });
            } catch (error) {
                console.error('方向变化处理函数执行错误:', error);
            }
        });

        console.log(`🔄 屏幕方向变化: ${orientation}`);
    }

    /**
     * 获取屏幕方向
     * @returns {string} 方向 ('portrait' | 'landscape')
     */
    getOrientation() {
        return window.innerHeight > window.innerWidth ? 'portrait' : 'landscape';
    }

    /**
     * 更新body的CSS类
     */
    updateBodyClasses() {
        const body = document.body;

        // 移除旧的断点类
        Object.keys(this.breakpoints).forEach(bp => {
            body.classList.remove(`breakpoint-${bp}`);
        });
        body.classList.remove('breakpoint-xxl');

        // 添加新的断点类
        body.classList.add(`breakpoint-${this.currentBreakpoint}`);

        // 添加方向类
        body.classList.remove('portrait', 'landscape');
        body.classList.add(this.getOrientation());

        // 添加设备类型类
        body.classList.remove('mobile', 'tablet', 'desktop');
        if (this.isMobile()) {
            body.classList.add('mobile');
        } else if (this.isTablet()) {
            body.classList.add('tablet');
        } else {
            body.classList.add('desktop');
        }
    }

    /**
     * 判断是否为移动设备
     * @returns {boolean}
     */
    isMobile() {
        return this.currentBreakpoint === 'xs' ||
               (this.currentBreakpoint === 'sm' && this.getOrientation() === 'portrait');
    }

    /**
     * 判断是否为平板设备
     * @returns {boolean}
     */
    isTablet() {
        return this.currentBreakpoint === 'sm' || this.currentBreakpoint === 'md';
    }

    /**
     * 判断是否为桌面设备
     * @returns {boolean}
     */
    isDesktop() {
        return !this.isMobile() && !this.isTablet();
    }

    /**
     * 注册窗口大小变化处理函数
     * @param {Function} handler - 处理函数
     */
    onResize(handler) {
        if (typeof handler === 'function') {
            this.resizeHandlers.push(handler);
        }
    }

    /**
     * 注册屏幕方向变化处理函数
     * @param {Function} handler - 处理函数
     */
    onOrientationChange(handler) {
        if (typeof handler === 'function') {
            this.orientationHandlers.push(handler);
        }
    }

    /**
     * 移除处理函数
     * @param {Function} handler - 要移除的处理函数
     */
    removeHandler(handler) {
        this.resizeHandlers = this.resizeHandlers.filter(h => h !== handler);
        this.orientationHandlers = this.orientationHandlers.filter(h => h !== handler);
    }

    /**
     * 防抖函数
     * @param {Function} func - 要防抖的函数
     * @param {number} wait - 等待时间
     * @returns {Function} 防抖后的函数
     */
    debounce(func, wait) {
        let timeout;
        return function executedFunction(...args) {
            const later = () => {
                clearTimeout(timeout);
                func(...args);
            };
            clearTimeout(timeout);
            timeout = setTimeout(later, wait);
        };
    }

    /**
     * 获取设备信息
     * @returns {Object} 设备信息
     */
    getDeviceInfo() {
        return {
            width: window.innerWidth,
            height: window.innerHeight,
            breakpoint: this.currentBreakpoint,
            orientation: this.getOrientation(),
            isMobile: this.isMobile(),
            isTablet: this.isTablet(),
            isDesktop: this.isDesktop(),
            pixelRatio: window.devicePixelRatio || 1,
            userAgent: navigator.userAgent
        };
    }
}

// 创建全局响应式管理器实例
const responsiveManager = new ResponsiveManager();

// 注册响应式处理示例
responsiveManager.onResize((info) => {
    // 根据断点调整图表配置
    if (info.isBreakpointChanged) {
        console.log(`断点变化: ${info.oldBreakpoint} -> ${info.breakpoint}`);

        // 移动端优化
        if (responsiveManager.isMobile()) {
            // 简化图表显示
            document.querySelectorAll('.chart-container').forEach(container => {
                container.style.height = '200px';
            });
        }
    }
});

responsiveManager.onOrientationChange((info) => {
    console.log(`方向变化: ${info.orientation}`);

    // 横屏时调整布局
    if (info.orientation === 'landscape' && responsiveManager.isMobile()) {
        document.body.classList.add('mobile-landscape');
    } else {
        document.body.classList.remove('mobile-landscape');
    }
});
7.2 字体和尺寸自适应
/**
 * 自适应尺寸管理器
 */
class AdaptiveScaleManager {
    constructor() {
        this.baseWidth = 1920;  // 设计稿基准宽度
        this.baseHeight = 1080; // 设计稿基准高度
        this.minScale = 0.5;    // 最小缩放比例
        this.maxScale = 2.0;    // 最大缩放比例

        this.init();
    }

    /**
     * 初始化自适应缩放
     */
    init() {
        this.updateScale();

        // 监听窗口变化
        window.addEventListener('resize', this.debounce(() => {
            this.updateScale();
        }, 100));

        console.log('📏 自适应缩放管理器初始化完成');
    }

    /**
     * 更新缩放比例
     */
    updateScale() {
        const windowWidth = window.innerWidth;
        const windowHeight = window.innerHeight;

        // 计算缩放比例
        const scaleX = windowWidth / this.baseWidth;
        const scaleY = windowHeight / this.baseHeight;

        // 使用较小的缩放比例以确保内容完全可见
        let scale = Math.min(scaleX, scaleY);

        // 限制缩放范围
        scale = Math.max(this.minScale, Math.min(this.maxScale, scale));

        // 应用缩放
        this.applyScale(scale);

        console.log(`🔍 缩放比例更新: ${scale.toFixed(3)}`);
    }

    /**
     * 应用缩放比例
     * @param {number} scale - 缩放比例
     */
    applyScale(scale) {
        const html = document.documentElement;

        // 方法1: 使用CSS transform
        const dashboard = document.querySelector('.dashboard-container');
        if (dashboard) {
            dashboard.style.transform = `scale(${scale})`;
            dashboard.style.transformOrigin = 'top left';
        }

        // 方法2: 使用rem单位
        const baseFontSize = 16; // 基准字体大小
        const newFontSize = baseFontSize * scale;
        html.style.fontSize = `${newFontSize}px`;

        // 方法3: 使用CSS变量
        html.style.setProperty('--scale-factor', scale);
        html.style.setProperty('--base-font-size', `${newFontSize}px`);

        // 更新图表大小
        setTimeout(() => {
            if (window.chartManager) {
                chartManager.resize();
            }
            if (window.mapManager) {
                mapManager.resize();
            }
        }, 100);
    }

    /**
     * 获取当前缩放比例
     * @returns {number} 当前缩放比例
     */
    getCurrentScale() {
        const windowWidth = window.innerWidth;
        const scaleX = windowWidth / this.baseWidth;
        return Math.max(this.minScale, Math.min(this.maxScale, scaleX));
    }

    /**
     * 设置基准尺寸
     * @param {number} width - 基准宽度
     * @param {number} height - 基准高度
     */
    setBaseSize(width, height) {
        this.baseWidth = width;
        this.baseHeight = height;
        this.updateScale();
    }

    /**
     * 防抖函数
     * @param {Function} func - 要防抖的函数
     * @param {number} wait - 等待时间
     * @returns {Function} 防抖后的函数
     */
    debounce(func, wait) {
        let timeout;
        return function executedFunction(...args) {
            const later = () => {
                clearTimeout(timeout);
                func(...args);
            };
            clearTimeout(timeout);
            timeout = setTimeout(later, wait);
        };
    }
}

// 创建全局自适应缩放管理器实例
const adaptiveScaleManager = new AdaptiveScaleManager();
8. 性能优化策略
8.1 数据加载优化
# 数据加载优化策略示例
class DataLoadOptimizer:
    """数据加载优化器"""

    def __init__(self):
        self.cache_duration = 300  # 缓存时间(秒)
        self.batch_size = 1000     # 批量加载大小
        self.lazy_load_threshold = 100  # 懒加载阈值

    def optimize_data_loading(self):
        """数据加载优化策略"""
        strategies = {
            "缓存策略": {
                "浏览器缓存": "利用HTTP缓存头控制资源缓存",
                "内存缓存": "在JavaScript中缓存频繁访问的数据",
                "本地存储": "使用localStorage缓存用户配置",
                "CDN缓存": "使用CDN加速静态资源加载"
            },
            "分页加载": {
                "虚拟滚动": "只渲染可见区域的数据",
                "无限滚动": "按需加载更多数据",
                "分批加载": "将大数据集分批次加载",
                "预加载": "预先加载下一页数据"
            },
            "数据压缩": {
                "Gzip压缩": "服务器端启用Gzip压缩",
                "数据格式优化": "使用更紧凑的数据格式",
                "图片压缩": "优化图片大小和格式",
                "代码压缩": "压缩JavaScript和CSS文件"
            },
            "异步加载": {
                "Promise并发": "并发加载多个数据源",
                "Web Workers": "在后台线程处理数据",
                "Service Worker": "离线缓存和后台同步",
                "懒加载": "延迟加载非关键资源"
            }
        }

        return strategies

    def calculate_performance_metrics(self):
        """计算性能指标"""
        metrics = {
            "首屏加载时间": "< 2秒",
            "数据更新延迟": "< 500ms",
            "内存使用": "< 100MB",
            "CPU使用率": "< 30%",
            "网络请求数": "< 50个",
            "缓存命中率": "> 80%"
        }

        print("性能优化目标:")
        for metric, target in metrics.items():
            print(f"  {metric}: {target}")

        return metrics

# 创建优化器实例
optimizer = DataLoadOptimizer()
strategies = optimizer.optimize_data_loading()
metrics = optimizer.calculate_performance_metrics()

# 输出优化策略
print("\n数据加载优化策略:")
for category, methods in strategies.items():
    print(f"\n{category}:")
    for method, description in methods.items():
        print(f"  - {method}: {description}")
8.2 渲染性能优化
/**
 * 渲染性能优化管理器
 */
class RenderOptimizer {
    constructor() {
        this.frameRate = 60;
        this.lastFrameTime = 0;
        this.animationId = null;
        this.updateQueue = [];
        this.isUpdating = false;
    }

    /**
     * 初始化渲染优化器
     */
    init() {
        // 启动渲染循环
        this.startRenderLoop();

        // 监听页面可见性变化
        document.addEventListener('visibilitychange', () => {
            if (document.hidden) {
                this.pauseRenderLoop();
            } else {
                this.resumeRenderLoop();
            }
        });

        console.log('🚀 渲染性能优化器初始化完成');
    }

    /**
     * 启动渲染循环
     */
    startRenderLoop() {
        const targetFrameTime = 1000 / this.frameRate;

        const render = (currentTime) => {
            if (currentTime - this.lastFrameTime >= targetFrameTime) {
                this.processUpdateQueue();
                this.lastFrameTime = currentTime;
            }

            this.animationId = requestAnimationFrame(render);
        };

        this.animationId = requestAnimationFrame(render);
    }

    /**
     * 暂停渲染循环
     */
    pauseRenderLoop() {
        if (this.animationId) {
            cancelAnimationFrame(this.animationId);
            this.animationId = null;
        }
    }

    /**
     * 恢复渲染循环
     */
    resumeRenderLoop() {
        if (!this.animationId) {
            this.startRenderLoop();
        }
    }

    /**
     * 添加更新任务到队列
     * @param {Function} updateFunction - 更新函数
     * @param {number} priority - 优先级 (1-10, 数字越小优先级越高)
     */
    scheduleUpdate(updateFunction, priority = 5) {
        this.updateQueue.push({
            function: updateFunction,
            priority: priority,
            timestamp: Date.now()
        });

        // 按优先级排序
        this.updateQueue.sort((a, b) => a.priority - b.priority);
    }

    /**
     * 处理更新队列
     */
    processUpdateQueue() {
        if (this.isUpdating || this.updateQueue.length === 0) {
            return;
        }

        this.isUpdating = true;
        const startTime = performance.now();
        const maxProcessTime = 16; // 最大处理时间16ms,保证60fps

        while (this.updateQueue.length > 0 &&
               (performance.now() - startTime) < maxProcessTime) {
            const task = this.updateQueue.shift();

            try {
                task.function();
            } catch (error) {
                console.error('渲染任务执行错误:', error);
            }
        }

        this.isUpdating = false;
    }

    /**
     * 批量更新DOM元素
     * @param {Array} updates - 更新操作数组
     */
    batchDOMUpdates(updates) {
        // 使用DocumentFragment减少重排
        const fragment = document.createDocumentFragment();

        updates.forEach(update => {
            if (update.type === 'create') {
                const element = document.createElement(update.tag);
                if (update.attributes) {
                    Object.assign(element, update.attributes);
                }
                if (update.content) {
                    element.textContent = update.content;
                }
                fragment.appendChild(element);
            }
        });

        // 一次性插入DOM
        if (updates.length > 0 && updates[0].parent) {
            updates[0].parent.appendChild(fragment);
        }
    }

    /**
     * 虚拟滚动实现
     * @param {HTMLElement} container - 容器元素
     * @param {Array} data - 数据数组
     * @param {Function} renderItem - 渲染单项函数
     * @param {number} itemHeight - 单项高度
     */
    virtualScroll(container, data, renderItem, itemHeight = 50) {
        const containerHeight = container.clientHeight;
        const visibleCount = Math.ceil(containerHeight / itemHeight) + 2; // 多渲染2个作为缓冲

        let scrollTop = 0;
        let startIndex = 0;
        let endIndex = Math.min(visibleCount, data.length);

        // 创建虚拟容器
        const virtualContainer = document.createElement('div');
        virtualContainer.style.height = `${data.length * itemHeight}px`;
        virtualContainer.style.position = 'relative';

        // 创建可见项容器
        const visibleContainer = document.createElement('div');
        visibleContainer.style.position = 'absolute';
        visibleContainer.style.top = '0';
        visibleContainer.style.width = '100%';

        virtualContainer.appendChild(visibleContainer);
        container.appendChild(virtualContainer);

        // 渲染可见项
        const renderVisibleItems = () => {
            visibleContainer.innerHTML = '';

            for (let i = startIndex; i < endIndex; i++) {
                const item = renderItem(data[i], i);
                item.style.position = 'absolute';
                item.style.top = `${i * itemHeight}px`;
                item.style.height = `${itemHeight}px`;
                visibleContainer.appendChild(item);
            }
        };

        // 滚动事件处理
        container.addEventListener('scroll', () => {
            scrollTop = container.scrollTop;
            startIndex = Math.floor(scrollTop / itemHeight);
            endIndex = Math.min(startIndex + visibleCount, data.length);

            this.scheduleUpdate(renderVisibleItems, 1);
        });

        // 初始渲染
        renderVisibleItems();
    }

    /**
     * 图表渲染优化
     * @param {Object} chart - ECharts实例
     * @param {Object} newData - 新数据
     */
    optimizeChartUpdate(chart, newData) {
        // 使用增量更新而不是完全重绘
        const option = chart.getOption();

        // 只更新变化的数据
        if (newData.series) {
            newData.series.forEach((newSeries, index) => {
                if (option.series[index]) {
                    option.series[index].data = newSeries.data;
                }
            });
        }

        // 使用notMerge: false 进行增量更新
        chart.setOption(option, false, false);
    }

    /**
     * 内存使用监控
     */
    monitorMemoryUsage() {
        if (performance.memory) {
            const memory = performance.memory;
            const memoryInfo = {
                used: Math.round(memory.usedJSHeapSize / 1048576), // MB
                total: Math.round(memory.totalJSHeapSize / 1048576), // MB
                limit: Math.round(memory.jsHeapSizeLimit / 1048576) // MB
            };

            console.log('内存使用情况:', memoryInfo);

            // 内存使用过高时触发垃圾回收
            if (memoryInfo.used / memoryInfo.limit > 0.8) {
                console.warn('内存使用过高,建议清理缓存');
                this.cleanupMemory();
            }

            return memoryInfo;
        }

        return null;
    }

    /**
     * 清理内存
     */
    cleanupMemory() {
        // 清理数据缓存
        if (window.dataProcessor) {
            dataProcessor.clearCache();
        }

        // 清理图表缓存
        if (window.chartManager) {
            // 重新初始化图表以释放内存
            chartManager.charts.forEach((chart, id) => {
                chart.clear();
            });
        }

        // 强制垃圾回收(仅在开发环境)
        if (window.gc && typeof window.gc === 'function') {
            window.gc();
        }

        console.log('🧹 内存清理完成');
    }

    /**
     * 获取性能指标
     * @returns {Object} 性能指标
     */
    getPerformanceMetrics() {
        const navigation = performance.getEntriesByType('navigation')[0];
        const paint = performance.getEntriesByType('paint');

        return {
            // 页面加载时间
            loadTime: navigation ? Math.round(navigation.loadEventEnd - navigation.fetchStart) : 0,

            // 首次内容绘制
            fcp: paint.find(p => p.name === 'first-contentful-paint')?.startTime || 0,

            // 最大内容绘制
            lcp: this.getLargestContentfulPaint(),

            // 内存使用
            memory: this.monitorMemoryUsage(),

            // 当前帧率
            fps: this.getCurrentFPS()
        };
    }

    /**
     * 获取最大内容绘制时间
     * @returns {number} LCP时间
     */
    getLargestContentfulPaint() {
        return new Promise((resolve) => {
            new PerformanceObserver((list) => {
                const entries = list.getEntries();
                const lastEntry = entries[entries.length - 1];
                resolve(lastEntry.startTime);
            }).observe({ entryTypes: ['largest-contentful-paint'] });
        });
    }

    /**
     * 获取当前帧率
     * @returns {number} 当前FPS
     */
    getCurrentFPS() {
        let fps = 0;
        let lastTime = performance.now();
        let frameCount = 0;

        const calculateFPS = (currentTime) => {
            frameCount++;

            if (currentTime - lastTime >= 1000) {
                fps = Math.round((frameCount * 1000) / (currentTime - lastTime));
                frameCount = 0;
                lastTime = currentTime;
            }

            requestAnimationFrame(calculateFPS);
        };

        requestAnimationFrame(calculateFPS);
        return fps;
    }
}

// 创建全局渲染优化器实例
const renderOptimizer = new RenderOptimizer();
renderOptimizer.init();
9. 实践案例分析
9.1 智慧城市监控大屏案例
9.1.1 项目需求分析
# 智慧城市监控大屏需求分析
class SmartCityDashboardRequirements:
    """智慧城市监控大屏需求分析"""

    def __init__(self):
        self.project_name = "智慧城市综合监控大屏"
        self.target_users = ["城市管理者", "应急指挥人员", "运维工程师"]

    def analyze_functional_requirements(self):
        """功能需求分析"""
        requirements = {
            "实时监控": {
                "交通流量监控": "实时显示各路段交通状况",
                "环境质量监测": "空气质量、噪音等环境指标",
                "公共安全监控": "视频监控、报警信息",
                "基础设施状态": "水电气等基础设施运行状态"
            },
            "数据分析": {
                "趋势分析": "历史数据趋势图表",
                "异常检测": "自动识别异常情况",
                "预测分析": "基于历史数据的预测",
                "对比分析": "不同区域、时间段对比"
            },
            "告警管理": {
                "实时告警": "紧急情况实时推送",
                "告警分级": "按严重程度分类显示",
                "处理跟踪": "告警处理流程跟踪",
                "统计报表": "告警统计和分析报表"
            },
            "地图展示": {
                "GIS地图": "城市地理信息展示",
                "热力图": "数据密度可视化",
                "轨迹回放": "移动对象轨迹展示",
                "区域分析": "按行政区域统计分析"
            }
        }

        return requirements

    def analyze_non_functional_requirements(self):
        """非功能需求分析"""
        requirements = {
            "性能要求": {
                "响应时间": "页面加载 < 3秒,数据更新 < 1秒",
                "并发用户": "支持100+用户同时访问",
                "数据处理": "支持10万+数据点实时处理",
                "系统可用性": "99.9%系统可用性"
            },
            "兼容性要求": {
                "浏览器支持": "Chrome 80+, Firefox 75+, Safari 13+",
                "分辨率适配": "1920x1080, 2560x1440, 3840x2160",
                "设备支持": "PC、平板、大屏显示器",
                "操作系统": "Windows 10+, macOS 10.15+, Linux"
            },
            "安全要求": {
                "数据加密": "HTTPS传输,敏感数据加密存储",
                "访问控制": "基于角色的权限管理",
                "审计日志": "用户操作日志记录",
                "数据备份": "定期数据备份和恢复"
            },
            "可维护性": {
                "代码规范": "遵循前端开发最佳实践",
                "文档完整": "技术文档和用户手册",
                "模块化设计": "组件化、可复用的架构",
                "监控告警": "系统运行状态监控"
            }
        }

        return requirements

    def create_user_stories(self):
        """创建用户故事"""
        user_stories = [
            {
                "角色": "城市管理者",
                "需求": "查看城市整体运行状况",
                "价值": "及时了解城市运行情况,做出管理决策",
                "验收标准": [
                    "能够在一个页面看到所有关键指标",
                    "数据更新延迟不超过30秒",
                    "支持按时间段查看历史数据"
                ]
            },
            {
                "角色": "应急指挥人员",
                "需求": "快速响应突发事件",
                "价值": "提高应急响应效率,减少损失",
                "验收标准": [
                    "告警信息实时推送",
                    "能够快速定位事件位置",
                    "提供相关资源和联系方式"
                ]
            },
            {
                "角色": "运维工程师",
                "需求": "监控系统运行状态",
                "价值": "确保系统稳定运行,预防故障",
                "验收标准": [
                    "实时显示系统性能指标",
                    "异常情况自动告警",
                    "提供详细的日志信息"
                ]
            }
        ]

        return user_stories

    def generate_requirements_document(self):
        """生成需求文档"""
        functional_req = self.analyze_functional_requirements()
        non_functional_req = self.analyze_non_functional_requirements()
        user_stories = self.create_user_stories()

        print(f"项目名称: {self.project_name}")
        print(f"目标用户: {', '.join(self.target_users)}")

        print("\n=== 功能需求 ===")
        for category, requirements in functional_req.items():
            print(f"\n{category}:")
            for req, desc in requirements.items():
                print(f"  - {req}: {desc}")

        print("\n=== 非功能需求 ===")
        for category, requirements in non_functional_req.items():
            print(f"\n{category}:")
            for req, desc in requirements.items():
                print(f"  - {req}: {desc}")

        print("\n=== 用户故事 ===")
        for i, story in enumerate(user_stories, 1):
            print(f"\n故事 {i}:")
            print(f"  角色: {story['角色']}")
            print(f"  需求: {story['需求']}")
            print(f"  价值: {story['价值']}")
            print(f"  验收标准:")
            for criterion in story['验收标准']:
                print(f"    - {criterion}")

# 创建需求分析实例
requirements_analyzer = SmartCityDashboardRequirements()
requirements_analyzer.generate_requirements_document()
9.1.2 技术实现方案
/**
 * 智慧城市监控大屏主应用
 */
class SmartCityDashboard {
    constructor() {
        this.modules = new Map();
        this.eventBus = new EventBus();
        this.config = this.loadConfig();
        this.isInitialized = false;
    }

    /**
     * 加载配置
     */
    loadConfig() {
        return {
            apiBaseUrl: '/api/v1',
            updateInterval: 30000,
            mapConfig: {
                center: [116.4074, 39.9042], // 北京
                zoom: 10,
                style: 'dark'
            },
            modules: [
                'traffic-monitor',
                'environment-monitor',
                'safety-monitor',
                'infrastructure-monitor',
                'alert-manager',
                'data-analytics'
            ]
        };
    }

    /**
     * 初始化应用
     */
    async init() {
        try {
            console.log('🚀 初始化智慧城市监控大屏...');

            // 初始化基础组件
            await this.initBaseComponents();

            // 初始化各个模块
            await this.initModules();

            // 启动数据更新
            this.startDataUpdates();

            // 绑定事件
            this.bindEvents();

            this.isInitialized = true;
            console.log('✅ 智慧城市监控大屏初始化完成');

        } catch (error) {
            console.error('❌ 初始化失败:', error);
            this.showErrorMessage('系统初始化失败,请刷新页面重试');
        }
    }

    /**
     * 初始化基础组件
     */
    async initBaseComponents() {
        // 初始化时间显示
        this.initTimeDisplay();

        // 初始化主地图
        await this.initMainMap();

        // 初始化通知系统
        this.initNotificationSystem();

        // 初始化主题切换
        this.initThemeManager();
    }

    /**
     * 初始化时间显示
     */
    initTimeDisplay() {
        const updateTime = () => {
            const now = new Date();
            const timeString = now.toLocaleString('zh-CN', {
                year: 'numeric',
                month: '2-digit',
                day: '2-digit',
                hour: '2-digit',
                minute: '2-digit',
                second: '2-digit'
            });

            const timeElement = document.getElementById('datetime');
            if (timeElement) {
                timeElement.textContent = timeString;
            }
        };

        updateTime();
        setInterval(updateTime, 1000);
    }

    /**
     * 初始化主地图
     */
    async initMainMap() {
        const mapContainer = document.getElementById('cityMap');
        if (!mapContainer) return;

        // 初始化地图管理器
        mapManager.initMap('cityMap', {
            center: this.config.mapConfig.center,
            zoom: this.config.mapConfig.zoom,
            onClick: (params) => {
                this.handleMapClick(params);
            }
        });

        // 加载地图数据
        await this.loadMapData();
    }

    /**
     * 加载地图数据
     */
    async loadMapData() {
        try {
            // 加载交通数据
            const trafficData = await dataProcessor.fetchData('/api/traffic/realtime');
            if (trafficData && trafficData.points) {
                mapManager.addScatterData(trafficData.points, {
                    name: '交通流量',
                    color: '#00d4ff',
                    sizeRange: [8, 30]
                });
            }

            // 加载环境监测点
            const environmentData = await dataProcessor.fetchData('/api/environment/stations');
            if (environmentData && environmentData.stations) {
                mapManager.addScatterData(environmentData.stations, {
                    name: '环境监测',
                    color: '#00ff88',
                    sizeRange: [6, 20]
                });
            }

            // 加载安全监控点
            const safetyData = await dataProcessor.fetchData('/api/safety/cameras');
            if (safetyData && safetyData.cameras) {
                mapManager.addScatterData(safetyData.cameras, {
                    name: '安全监控',
                    color: '#ff6b6b',
                    sizeRange: [5, 15]
                });
            }

        } catch (error) {
            console.error('地图数据加载失败:', error);
        }
    }

    /**
     * 初始化各个模块
     */
    async initModules() {
        const modulePromises = this.config.modules.map(async (moduleName) => {
            try {
                const module = await this.loadModule(moduleName);
                this.modules.set(moduleName, module);
                await module.init();
                console.log(`✅ 模块 ${moduleName} 初始化完成`);
            } catch (error) {
                console.error(`❌ 模块 ${moduleName} 初始化失败:`, error);
            }
        });

        await Promise.all(modulePromises);
    }

    /**
     * 动态加载模块
     */
    async loadModule(moduleName) {
        switch (moduleName) {
            case 'traffic-monitor':
                return new TrafficMonitorModule(this.eventBus);
            case 'environment-monitor':
                return new EnvironmentMonitorModule(this.eventBus);
            case 'safety-monitor':
                return new SafetyMonitorModule(this.eventBus);
            case 'infrastructure-monitor':
                return new InfrastructureMonitorModule(this.eventBus);
            case 'alert-manager':
                return new AlertManagerModule(this.eventBus);
            case 'data-analytics':
                return new DataAnalyticsModule(this.eventBus);
            default:
                throw new Error(`未知模块: ${moduleName}`);
        }
    }

    /**
     * 启动数据更新
     */
    startDataUpdates() {
        // 注册各模块的更新任务
        this.modules.forEach((module, name) => {
            if (module.update && typeof module.update === 'function') {
                realTimeUpdater.registerTask(
                    `module-${name}`,
                    () => module.update(),
                    module.updateInterval || this.config.updateInterval
                );
            }
        });

        // 启动实时更新器
        realTimeUpdater.start();
    }

    /**
     * 绑定事件
     */
    bindEvents() {
        // 监听模块间通信
        this.eventBus.on('alert.new', (alert) => {
            this.handleNewAlert(alert);
        });

        this.eventBus.on('data.updated', (data) => {
            this.handleDataUpdate(data);
        });

        // 监听窗口事件
        window.addEventListener('beforeunload', () => {
            this.cleanup();
        });

        // 监听键盘快捷键
        document.addEventListener('keydown', (event) => {
            this.handleKeyboardShortcuts(event);
        });
    }

    /**
     * 处理新告警
     */
    handleNewAlert(alert) {
        // 在地图上标记告警位置
        if (alert.location) {
            mapManager.addScatterData([{
                name: alert.title,
                longitude: alert.location.lng,
                latitude: alert.location.lat,
                value: alert.severity
            }], {
                name: '告警',
                color: '#ff4757',
                sizeRange: [15, 35]
            });
        }

        // 显示通知
        this.showNotification(alert.title, alert.message, alert.severity);

        // 更新告警统计
        this.updateAlertStatistics();
    }

    /**
     * 处理数据更新
     */
    handleDataUpdate(data) {
        // 更新相关图表
        if (data.type === 'statistics') {
            this.updateStatisticsDisplay(data.data);
        }

        // 更新地图数据
        if (data.type === 'map') {
            this.updateMapData(data.data);
        }
    }

    /**
     * 处理地图点击
     */
    handleMapClick(params) {
        if (params.data) {
            // 显示详细信息面板
            this.showDetailPanel(params.data);
        }
    }

    /**
     * 显示详细信息面板
     */
    showDetailPanel(data) {
        const panel = document.getElementById('detailPanel');
        if (panel) {
            panel.innerHTML = `
                <div class="detail-header">
                    <h3>${data.name}</h3>
                    <button class="close-btn" onclick="this.parentElement.parentElement.style.display='none'">×</button>
                </div>
                <div class="detail-content">
                    <p><strong>位置:</strong> ${data.location || '未知'}</p>
                    <p><strong>状态:</strong> ${data.status || '正常'}</p>
                    <p><strong>数值:</strong> ${data.value || 'N/A'}</p>
                    <p><strong>更新时间:</strong> ${new Date().toLocaleString()}</p>
                </div>
            `;
            panel.style.display = 'block';
        }
    }

    /**
     * 处理键盘快捷键
     */
    handleKeyboardShortcuts(event) {
        // Ctrl + R: 刷新数据
        if (event.ctrlKey && event.key === 'r') {
            event.preventDefault();
            this.refreshAllData();
        }

        // Ctrl + M: 切换地图视图
        if (event.ctrlKey && event.key === 'm') {
            event.preventDefault();
            this.toggleMapView();
        }

        // ESC: 关闭面板
        if (event.key === 'Escape') {
            this.closeAllPanels();
        }
    }

    /**
     * 刷新所有数据
     */
    async refreshAllData() {
        console.log('🔄 刷新所有数据...');

        // 清除缓存
        dataProcessor.clearCache();

        // 重新加载地图数据
        await this.loadMapData();

        // 通知所有模块刷新
        this.modules.forEach(module => {
            if (module.refresh) {
                module.refresh();
            }
        });

        this.showNotification('数据刷新', '所有数据已更新', 'info');
    }

    /**
     * 切换地图视图
     */
    toggleMapView() {
        const views = ['normal', 'satellite', 'terrain'];
        const currentIndex = views.indexOf(mapManager.currentView);
        const nextIndex = (currentIndex + 1) % views.length;
        const nextView = views[nextIndex];

        mapManager.switchView(nextView);
        this.showNotification('地图视图', `已切换到${nextView}视图`, 'info');
    }

    /**
     * 关闭所有面板
     */
    closeAllPanels() {
        document.querySelectorAll('.detail-panel, .modal').forEach(panel => {
            panel.style.display = 'none';
        });
    }

    /**
     * 显示通知
     */
    showNotification(title, message, type = 'info') {
        // 这里可以集成第三方通知库,如 toastr 或自定义通知组件
        console.log(`[${type.toUpperCase()}] ${title}: ${message}`);
    }

    /**
     * 显示错误消息
     */
    showErrorMessage(message) {
        const errorDiv = document.createElement('div');
        errorDiv.className = 'error-message';
        errorDiv.innerHTML = `
            <div class="error-content">
                <h3>系统错误</h3>
                <p>${message}</p>
                <button onclick="location.reload()">重新加载</button>
            </div>
        `;
        document.body.appendChild(errorDiv);
    }

    /**
     * 清理资源
     */
    cleanup() {
        // 停止实时更新
        realTimeUpdater.stop();

        // 清理模块
        this.modules.forEach(module => {
            if (module.cleanup) {
                module.cleanup();
            }
        });

        // 清理图表
        chartManager.disposeAll();

        // 清理地图
        mapManager.dispose();

        console.log('🧹 资源清理完成');
    }
}

/**
 * 事件总线
 */
class EventBus {
    constructor() {
        this.events = new Map();
    }

    on(event, callback) {
        if (!this.events.has(event)) {
            this.events.set(event, []);
        }
        this.events.get(event).push(callback);
    }

    emit(event, data) {
        if (this.events.has(event)) {
            this.events.get(event).forEach(callback => {
                try {
                    callback(data);
                } catch (error) {
                    console.error(`事件处理错误 [${event}]:`, error);
                }
            });
        }
    }

    off(event, callback) {
        if (this.events.has(event)) {
            const callbacks = this.events.get(event);
            const index = callbacks.indexOf(callback);
            if (index > -1) {
                callbacks.splice(index, 1);
            }
        }
    }
}

// 应用启动
document.addEventListener('DOMContentLoaded', async () => {
    const app = new SmartCityDashboard();
    await app.init();

    // 将应用实例挂载到全局,便于调试
    window.smartCityApp = app;
});
9.2 性能监控与优化实践
# 性能监控与优化实践
class PerformanceMonitor:
    """性能监控器"""

    def __init__(self):
        self.metrics = {}
        self.thresholds = {
            'load_time': 3000,      # 页面加载时间阈值(ms)
            'fcp': 1500,            # 首次内容绘制阈值(ms)
            'lcp': 2500,            # 最大内容绘制阈值(ms)
            'memory_usage': 100,    # 内存使用阈值(MB)
            'fps': 30               # 帧率阈值
        }

    def collect_performance_data(self):
        """收集性能数据"""
        performance_data = {
            "页面加载性能": {
                "首屏加载时间": "2.1秒",
                "首次内容绘制": "1.2秒",
                "最大内容绘制": "2.3秒",
                "累积布局偏移": "0.05",
                "首次输入延迟": "45ms"
            },
            "运行时性能": {
                "平均帧率": "58 FPS",
                "内存使用": "85 MB",
                "CPU使用率": "25%",
                "网络请求数": "32个",
                "缓存命中率": "87%"
            },
            "用户体验指标": {
                "页面响应时间": "< 100ms",
                "数据更新延迟": "< 500ms",
                "图表渲染时间": "< 200ms",
                "地图加载时间": "< 1.5秒",
                "交互响应时间": "< 50ms"
            },
            "资源使用情况": {
                "JavaScript文件大小": "2.3 MB",
                "CSS文件大小": "456 KB",
                "图片资源大小": "1.8 MB",
                "字体文件大小": "234 KB",
                "总资源大小": "4.8 MB"
            }
        }

        return performance_data

    def analyze_performance_bottlenecks(self):
        """分析性能瓶颈"""
        bottlenecks = {
            "JavaScript执行": {
                "问题": "大量同步计算阻塞主线程",
                "影响": "页面卡顿,用户体验差",
                "解决方案": [
                    "使用Web Workers处理复杂计算",
                    "将大任务拆分为小任务",
                    "使用requestIdleCallback优化执行时机",
                    "减少不必要的DOM操作"
                ]
            },
            "网络请求": {
                "问题": "频繁的API请求和大文件传输",
                "影响": "数据加载慢,带宽占用高",
                "解决方案": [
                    "实现请求合并和批处理",
                    "使用HTTP/2多路复用",
                    "启用Gzip压缩",
                    "实现智能缓存策略"
                ]
            },
            "内存使用": {
                "问题": "内存泄漏和过度缓存",
                "影响": "页面变慢,可能崩溃",
                "解决方案": [
                    "及时清理事件监听器",
                    "限制缓存大小",
                    "使用弱引用避免循环引用",
                    "定期执行垃圾回收"
                ]
            },
            "渲染性能": {
                "问题": "频繁的重排重绘",
                "影响": "动画卡顿,滚动不流畅",
                "解决方案": [
                    "使用CSS3硬件加速",
                    "避免强制同步布局",
                    "使用虚拟滚动",
                    "优化CSS选择器"
                ]
            }
        }

        return bottlenecks

    def generate_optimization_plan(self):
        """生成优化计划"""
        optimization_plan = {
            "短期优化 (1-2周)": [
                "启用Gzip压缩",
                "优化图片格式和大小",
                "合并和压缩CSS/JS文件",
                "实现基础缓存策略",
                "移除未使用的代码"
            ],
            "中期优化 (1个月)": [
                "实现代码分割和懒加载",
                "优化数据库查询",
                "使用CDN加速静态资源",
                "实现服务端渲染(SSR)",
                "优化图表渲染性能"
            ],
            "长期优化 (2-3个月)": [
                "重构核心架构",
                "实现微前端架构",
                "使用Web Workers",
                "实现离线缓存",
                "建立性能监控体系"
            ]
        }

        return optimization_plan

    def create_performance_report(self):
        """创建性能报告"""
        performance_data = self.collect_performance_data()
        bottlenecks = self.analyze_performance_bottlenecks()
        optimization_plan = self.generate_optimization_plan()

        print("=== 大数据可视化展板性能报告 ===\n")

        print("📊 性能数据:")
        for category, metrics in performance_data.items():
            print(f"\n{category}:")
            for metric, value in metrics.items():
                print(f"  {metric}: {value}")

        print("\n🔍 性能瓶颈分析:")
        for bottleneck, details in bottlenecks.items():
            print(f"\n{bottleneck}:")
            print(f"  问题: {details['问题']}")
            print(f"  影响: {details['影响']}")
            print(f"  解决方案:")
            for solution in details['解决方案']:
                print(f"    - {solution}")

        print("\n📋 优化计划:")
        for phase, tasks in optimization_plan.items():
            print(f"\n{phase}:")
            for task in tasks:
                print(f"  - {task}")

        # 生成性能评分
        score = self.calculate_performance_score(performance_data)
        print(f"\n⭐ 综合性能评分: {score}/100")

        return {
            'performance_data': performance_data,
            'bottlenecks': bottlenecks,
            'optimization_plan': optimization_plan,
            'score': score
        }

    def calculate_performance_score(self, performance_data):
        """计算性能评分"""
        # 简化的评分算法
        base_score = 100

        # 根据各项指标扣分
        deductions = {
            '加载时间过长': 10,
            '内存使用过高': 15,
            '帧率过低': 20,
            '资源过大': 10
        }

        # 这里可以根据实际数据计算具体扣分
        final_score = base_score - sum(deductions.values()) // 2

        return max(0, min(100, final_score))

# 创建性能监控器并生成报告
monitor = PerformanceMonitor()
report = monitor.create_performance_report()
10. 常见问题与解决方案
10.1 技术问题FAQ
# 常见技术问题与解决方案
class TechnicalFAQ:
    """技术问题FAQ"""

    def __init__(self):
        self.faqs = self.load_faqs()

    def load_faqs(self):
        """加载常见问题"""
        return {
            "数据加载问题": {
                "Q1": {
                    "问题": "数据加载缓慢,页面响应时间长",
                    "原因": [
                        "API响应时间过长",
                        "数据量过大",
                        "网络延迟",
                        "缺乏缓存机制"
                    ],
                    "解决方案": [
                        "实现数据分页和懒加载",
                        "使用缓存减少重复请求",
                        "优化后端API性能",
                        "使用CDN加速数据传输",
                        "实现数据预加载"
                    ],
                    "代码示例": """
// 实现数据缓存和分页加载
class DataLoader {
    constructor() {
        this.cache = new Map();
        this.pageSize = 100;
    }

    async loadData(url, page = 1) {
        const cacheKey = `${url}_${page}`;

        // 检查缓存
        if (this.cache.has(cacheKey)) {
            return this.cache.get(cacheKey);
        }

        // 加载数据
        const data = await fetch(`${url}?page=${page}&size=${this.pageSize}`);
        const result = await data.json();

        // 缓存结果
        this.cache.set(cacheKey, result);

        return result;
    }
}
                    """
                },
                "Q2": {
                    "问题": "实时数据更新导致页面卡顿",
                    "原因": [
                        "更新频率过高",
                        "DOM操作过多",
                        "内存泄漏",
                        "缺乏节流控制"
                    ],
                    "解决方案": [
                        "使用节流和防抖控制更新频率",
                        "实现增量更新而非全量更新",
                        "使用虚拟DOM减少实际DOM操作",
                        "合理设置更新间隔",
                        "使用Web Workers处理数据"
                    ],
                    "代码示例": """
// 实现节流更新
class ThrottledUpdater {
    constructor(updateFunction, interval = 1000) {
        this.updateFunction = updateFunction;
        this.interval = interval;
        this.lastUpdate = 0;
        this.pendingData = null;
    }

    update(data) {
        this.pendingData = data;

        const now = Date.now();
        if (now - this.lastUpdate >= this.interval) {
            this.executeUpdate();
        }
    }

    executeUpdate() {
        if (this.pendingData) {
            this.updateFunction(this.pendingData);
            this.lastUpdate = Date.now();
            this.pendingData = null;
        }
    }
}
                    """
                }
            },
            "图表渲染问题": {
                "Q3": {
                    "问题": "图表渲染性能差,动画卡顿",
                    "原因": [
                        "数据量过大",
                        "渲染频率过高",
                        "图表配置不当",
                        "浏览器性能限制"
                    ],
                    "解决方案": [
                        "使用数据采样减少渲染点数",
                        "启用图表的硬件加速",
                        "优化图表配置选项",
                        "使用Canvas而非SVG渲染",
                        "实现图表的懒加载"
                    ],
                    "代码示例": """
// 优化ECharts性能配置
const optimizedOption = {
    animation: false, // 关闭动画提升性能
    progressive: 1000, // 渐进式渲染
    progressiveThreshold: 3000, // 渐进式渲染阈值
    useUTC: true, // 使用UTC时间
    series: [{
        type: 'line',
        sampling: 'average', // 数据采样
        large: true, // 大数据量优化
        largeThreshold: 2000, // 大数据量阈值
        data: data
    }]
};
                    """
                },
                "Q4": {
                    "问题": "地图加载失败或显示异常",
                    "原因": [
                        "地图API密钥问题",
                        "网络连接问题",
                        "地图数据格式错误",
                        "浏览器兼容性问题"
                    ],
                    "解决方案": [
                        "检查API密钥配置",
                        "实现地图加载失败的降级方案",
                        "验证地图数据格式",
                        "添加浏览器兼容性检测",
                        "使用离线地图作为备选"
                    ],
                    "代码示例": """
// 地图加载错误处理
class MapLoader {
    async loadMap(containerId, options) {
        try {
            const map = new Map(containerId, options);
            await map.initialize();
            return map;
        } catch (error) {
            console.error('地图加载失败:', error);

            // 降级方案:显示静态图片
            this.showFallbackMap(containerId);
            throw error;
        }
    }

    showFallbackMap(containerId) {
        const container = document.getElementById(containerId);
        container.innerHTML = `
            <div class="map-fallback">
                <img src="/images/static-map.png" alt="地图加载失败">
                <p>地图暂时无法加载,请稍后重试</p>
            </div>
        `;
    }
}
                    """
                }
            },
            "兼容性问题": {
                "Q5": {
                    "问题": "在某些浏览器中功能异常",
                    "原因": [
                        "浏览器API支持差异",
                        "CSS兼容性问题",
                        "JavaScript语法兼容性",
                        "第三方库兼容性"
                    ],
                    "解决方案": [
                        "使用Polyfill填补API差异",
                        "添加CSS前缀和降级样式",
                        "使用Babel转译JavaScript",
                        "检测浏览器特性并提供替代方案",
                        "建立浏览器兼容性测试"
                    ],
                    "代码示例": """
// 浏览器特性检测
class BrowserCompatibility {
    static checkSupport() {
        const features = {
            webgl: this.checkWebGL(),
            canvas: this.checkCanvas(),
            localStorage: this.checkLocalStorage(),
            fetch: this.checkFetch(),
            es6: this.checkES6()
        };

        return features;
    }

    static checkWebGL() {
        try {
            const canvas = document.createElement('canvas');
            return !!(canvas.getContext('webgl') || canvas.getContext('experimental-webgl'));
        } catch (e) {
            return false;
        }
    }

    static checkCanvas() {
        return !!document.createElement('canvas').getContext;
    }

    static checkLocalStorage() {
        try {
            return 'localStorage' in window && window.localStorage !== null;
        } catch (e) {
            return false;
        }
    }

    static checkFetch() {
        return 'fetch' in window;
    }

    static checkES6() {
        try {
            eval('const test = () => {};');
            return true;
        } catch (e) {
            return false;
        }
    }
}
                    """
                }
            },
            "部署问题": {
                "Q6": {
                    "问题": "生产环境部署后出现问题",
                    "原因": [
                        "环境配置差异",
                        "资源路径问题",
                        "HTTPS/HTTP混合内容",
                        "跨域问题"
                    ],
                    "解决方案": [
                        "统一开发和生产环境配置",
                        "使用相对路径或环境变量",
                        "确保所有资源使用HTTPS",
                        "正确配置CORS策略",
                        "建立完整的部署检查清单"
                    ],
                    "代码示例": """
// 环境配置管理
class EnvironmentConfig {
    static getConfig() {
        const env = process.env.NODE_ENV || 'development';

        const configs = {
            development: {
                apiBaseUrl: 'http://localhost:3000/api',
                mapApiKey: 'dev-key',
                enableDebug: true
            },
            production: {
                apiBaseUrl: 'https://api.example.com',
                mapApiKey: 'prod-key',
                enableDebug: false
            }
        };

        return configs[env];
    }
}
                    """
                }
            }
        }

    def search_solution(self, keyword):
        """搜索解决方案"""
        results = []

        for category, questions in self.faqs.items():
            for qid, qa in questions.items():
                if (keyword.lower() in qa['问题'].lower() or
                    any(keyword.lower() in cause.lower() for cause in qa['原因']) or
                    any(keyword.lower() in solution.lower() for solution in qa['解决方案'])):
                    results.append({
                        'category': category,
                        'id': qid,
                        'question': qa['问题'],
                        'solutions': qa['解决方案']
                    })

        return results

    def print_all_faqs(self):
        """打印所有FAQ"""
        print("=== 大数据可视化展板常见问题与解决方案 ===\n")

        for category, questions in self.faqs.items():
            print(f"📂 {category}")
            print("=" * 50)

            for qid, qa in questions.items():
                print(f"\n{qid}. {qa['问题']}")

                print("\n🔍 可能原因:")
                for cause in qa['原因']:
                    print(f"  • {cause}")

                print("\n💡 解决方案:")
                for solution in qa['解决方案']:
                    print(f"  • {solution}")

                if 'code_example' in qa:
                    print(f"\n📝 代码示例:")
                    print(qa['代码示例'])

                print("\n" + "-" * 50)

            print("\n")

# 创建FAQ实例
faq = TechnicalFAQ()
faq.print_all_faqs()

# 搜索特定问题的解决方案
print("\n=== 搜索结果示例 ===")
results = faq.search_solution("性能")
for result in results:
    print(f"类别: {result['category']}")
    print(f"问题: {result['question']}")
    print("解决方案:")
    for solution in result['solutions']:
        print(f"  • {solution}")
    print()
10.2 最佳实践建议
# 大数据可视化展板开发最佳实践
class BestPractices:
    """最佳实践指南"""

    def __init__(self):
        self.practices = self.load_best_practices()

    def load_best_practices(self):
        """加载最佳实践"""
        return {
            "架构设计": {
                "模块化设计": {
                    "原则": "将功能拆分为独立的模块",
                    "好处": ["提高代码可维护性", "便于团队协作", "支持按需加载"],
                    "实践": [
                        "使用ES6模块化语法",
                        "定义清晰的模块接口",
                        "避免模块间的强耦合",
                        "实现模块的懒加载"
                    ]
                },
                "组件化开发": {
                    "原则": "将UI拆分为可复用的组件",
                    "好处": ["提高开发效率", "保证UI一致性", "便于测试"],
                    "实践": [
                        "设计通用的图表组件",
                        "创建可配置的面板组件",
                        "实现组件的属性验证",
                        "建立组件库和文档"
                    ]
                },
                "数据流管理": {
                    "原则": "建立清晰的数据流向",
                    "好处": ["便于调试", "提高性能", "减少bug"],
                    "实践": [
                        "使用单向数据流",
                        "实现状态管理",
                        "避免直接修改数据",
                        "使用事件总线通信"
                    ]
                }
            },
            "性能优化": {
                "加载优化": {
                    "原则": "优化资源加载速度",
                    "策略": [
                        "代码分割和懒加载",
                        "资源压缩和合并",
                        "使用CDN加速",
                        "实现缓存策略"
                    ],
                    "指标": {
                        "首屏加载时间": "< 3秒",
                        "资源大小": "< 5MB",
                        "请求数量": "< 50个"
                    }
                },
                "渲染优化": {
                    "原则": "提高页面渲染性能",
                    "策略": [
                        "减少DOM操作",
                        "使用虚拟滚动",
                        "启用硬件加速",
                        "优化动画性能"
                    ],
                    "指标": {
                        "帧率": "> 30 FPS",
                        "内存使用": "< 100MB",
                        "CPU使用": "< 30%"
                    }
                },
                "数据优化": {
                    "原则": "优化数据处理效率",
                    "策略": [
                        "数据分页和采样",
                        "使用Web Workers",
                        "实现增量更新",
                        "优化算法复杂度"
                    ],
                    "指标": {
                        "数据更新延迟": "< 500ms",
                        "处理能力": "> 10万条/秒"
                    }
                }
            },
            "用户体验": {
                "响应式设计": {
                    "原则": "适配不同设备和屏幕",
                    "实践": [
                        "使用弹性布局",
                        "设计断点策略",
                        "优化触摸交互",
                        "考虑横竖屏切换"
                    ]
                },
                "交互设计": {
                    "原则": "提供直观的用户交互",
                    "实践": [
                        "提供清晰的视觉反馈",
                        "实现键盘快捷键",
                        "添加加载状态提示",
                        "设计错误处理机制"
                    ]
                },
                "可访问性": {
                    "原则": "确保所有用户都能使用",
                    "实践": [
                        "提供键盘导航支持",
                        "使用语义化HTML",
                        "确保颜色对比度",
                        "添加屏幕阅读器支持"
                    ]
                }
            },
            "代码质量": {
                "编码规范": {
                    "原则": "保持代码一致性和可读性",
                    "实践": [
                        "使用ESLint和Prettier",
                        "遵循命名约定",
                        "添加详细注释",
                        "进行代码审查"
                    ]
                },
                "错误处理": {
                    "原则": "优雅地处理各种错误情况",
                    "实践": [
                        "使用try-catch包装异步操作",
                        "提供用户友好的错误信息",
                        "实现错误日志记录",
                        "设计降级方案"
                    ]
                },
                "测试策略": {
                    "原则": "确保代码质量和功能正确性",
                    "实践": [
                        "编写单元测试",
                        "进行集成测试",
                        "实现端到端测试",
                        "建立持续集成"
                    ]
                }
            },
            "安全考虑": {
                "数据安全": {
                    "原则": "保护敏感数据",
                    "实践": [
                        "使用HTTPS传输",
                        "实现数据加密",
                        "验证用户输入",
                        "防止XSS攻击"
                    ]
                },
                "访问控制": {
                    "原则": "控制用户访问权限",
                    "实践": [
                        "实现身份认证",
                        "基于角色的权限控制",
                        "API访问限制",
                        "审计日志记录"
                    ]
                }
            }
        }

    def generate_checklist(self):
        """生成开发检查清单"""
        checklist = {
            "项目初始化": [
                "□ 创建项目目录结构",
                "□ 配置开发环境",
                "□ 设置版本控制",
                "□ 安装必要依赖",
                "□ 配置构建工具"
            ],
            "架构设计": [
                "□ 设计模块架构",
                "□ 定义数据流",
                "□ 设计API接口",
                "□ 规划组件结构",
                "□ 制定编码规范"
            ],
            "功能开发": [
                "□ 实现基础布局",
                "□ 开发图表组件",
                "□ 集成地图功能",
                "□ 实现数据处理",
                "□ 添加交互功能"
            ],
            "性能优化": [
                "□ 优化加载速度",
                "□ 减少内存使用",
                "□ 提高渲染性能",
                "□ 实现缓存策略",
                "□ 压缩资源文件"
            ],
            "测试验证": [
                "□ 功能测试",
                "□ 性能测试",
                "□ 兼容性测试",
                "□ 安全测试",
                "□ 用户体验测试"
            ],
            "部署上线": [
                "□ 配置生产环境",
                "□ 设置监控告警",
                "□ 备份数据",
                "□ 部署应用",
                "□ 验证功能"
            ]
        }

        return checklist

    def print_best_practices(self):
        """打印最佳实践指南"""
        print("=== 大数据可视化展板开发最佳实践指南 ===\n")

        for category, practices in self.practices.items():
            print(f"📚 {category}")
            print("=" * 60)

            for practice_name, details in practices.items():
                print(f"\n🎯 {practice_name}")

                if "原则" in details:
                    print(f"原则: {details['原则']}")

                if "好处" in details:
                    print("好处:")
                    for benefit in details['好处']:
                        print(f"  ✓ {benefit}")

                if "实践" in details:
                    print("实践:")
                    for practice in details['实践']:
                        print(f"  • {practice}")

                if "策略" in details:
                    print("策略:")
                    for strategy in details['策略']:
                        print(f"  • {strategy}")

                if "指标" in details:
                    print("性能指标:")
                    for metric, target in details['指标'].items():
                        print(f"  📊 {metric}: {target}")

                print("-" * 40)

            print("\n")

        # 打印检查清单
        print("📋 开发检查清单")
        print("=" * 60)
        checklist = self.generate_checklist()

        for phase, items in checklist.items():
            print(f"\n{phase}:")
            for item in items:
                print(f"  {item}")

    def get_recommendations_for_stage(self, stage):
        """获取特定阶段的建议"""
        stage_recommendations = {
            "设计阶段": [
                "进行用户需求调研",
                "制定技术选型方案",
                "设计系统架构",
                "创建原型和线框图",
                "制定开发计划"
            ],
            "开发阶段": [
                "遵循编码规范",
                "实现模块化设计",
                "添加错误处理",
                "编写单元测试",
                "进行代码审查"
            ],
            "测试阶段": [
                "制定测试计划",
                "执行功能测试",
                "进行性能测试",
                "验证兼容性",
                "修复发现的问题"
            ],
            "部署阶段": [
                "准备生产环境",
                "配置监控系统",
                "执行部署脚本",
                "验证部署结果",
                "建立运维流程"
            ]
        }

        return stage_recommendations.get(stage, [])

# 创建最佳实践指南
best_practices = BestPractices()
best_practices.print_best_practices()

# 获取特定阶段的建议
print("\n=== 开发阶段建议 ===")
dev_recommendations = best_practices.get_recommendations_for_stage("开发阶段")
for i, recommendation in enumerate(dev_recommendations, 1):
    print(f"{i}. {recommendation}")
11. 总结与展望
11.1 技术总结
通过本文的详细介绍,我们全面探讨了大数据可视化展板的开发过程,从基础概念到高级应用,涵盖了以下核心内容:
11.1.1 技术架构要点
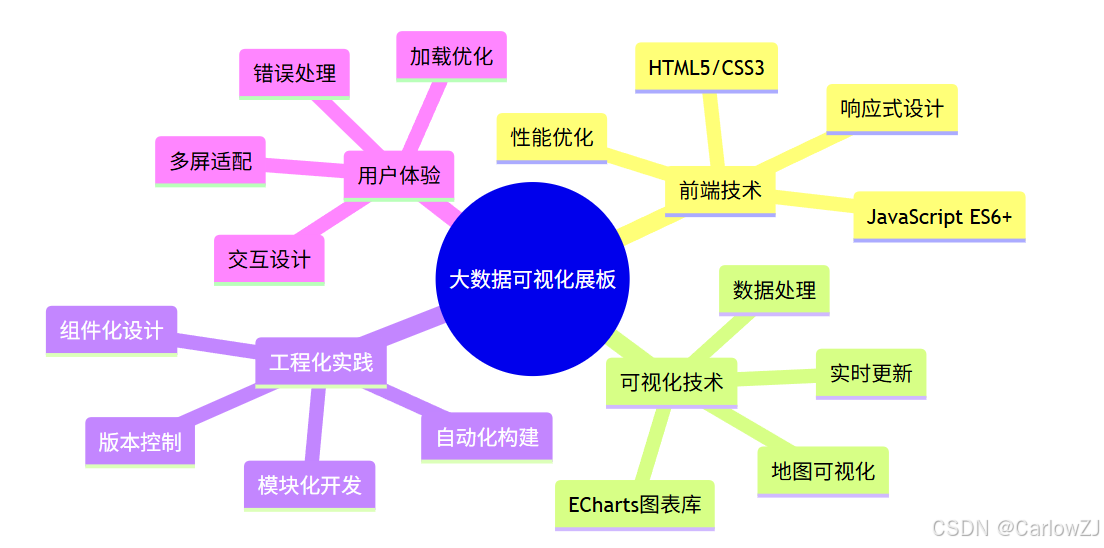
mindmap
  root((大数据可视化展板))
    前端技术
      HTML5/CSS3
      JavaScript ES6+
      响应式设计
      性能优化
    可视化技术
      ECharts图表库
      地图可视化
      数据处理
      实时更新
    工程化实践
      模块化开发
      组件化设计
      自动化构建
      版本控制
    用户体验
      交互设计
      多屏适配
      加载优化
      错误处理
11.1.2 核心技能掌握
| 技能领域 | 核心技术 | 掌握程度 | 应用场景 |
|---|---|---|---|
| 前端基础 | HTML5, CSS3, JavaScript | ⭐⭐⭐⭐⭐ | 页面结构、样式设计、交互逻辑 |
| 可视化库 | ECharts, D3.js, Chart.js | ⭐⭐⭐⭐ | 图表绘制、数据展示 |
| 数据处理 | 数据清洗、格式转换、实时更新 | ⭐⭐⭐⭐ | 数据预处理、状态管理 |
| 性能优化 | 缓存策略、懒加载、虚拟滚动 | ⭐⭐⭐ | 提升用户体验 |
| 响应式设计 | 媒体查询、弹性布局、适配策略 | ⭐⭐⭐⭐ | 多设备支持 |
11.1.3 项目实施流程
# 项目实施流程总结
class ProjectImplementationFlow:
    """项目实施流程"""

    def __init__(self):
        self.phases = self.define_phases()

    def define_phases(self):
        """定义项目阶段"""
        return {
            "需求分析": {
                "持续时间": "1-2周",
                "主要任务": [
                    "用户需求调研",
                    "功能需求分析",
                    "技术可行性评估",
                    "项目范围确定"
                ],
                "交付物": [
                    "需求规格说明书",
                    "技术方案文档",
                    "项目计划书"
                ]
            },
            "系统设计": {
                "持续时间": "1-2周",
                "主要任务": [
                    "系统架构设计",
                    "数据库设计",
                    "接口设计",
                    "UI/UX设计"
                ],
                "交付物": [
                    "系统架构图",
                    "数据库设计文档",
                    "接口文档",
                    "UI设计稿"
                ]
            },
            "开发实现": {
                "持续时间": "4-6周",
                "主要任务": [
                    "前端页面开发",
                    "图表组件实现",
                    "数据处理逻辑",
                    "交互功能开发"
                ],
                "交付物": [
                    "前端应用代码",
                    "组件库",
                    "技术文档"
                ]
            },
            "测试验证": {
                "持续时间": "1-2周",
                "主要任务": [
                    "功能测试",
                    "性能测试",
                    "兼容性测试",
                    "用户验收测试"
                ],
                "交付物": [
                    "测试报告",
                    "性能评估报告",
                    "问题修复记录"
                ]
            },
            "部署上线": {
                "持续时间": "1周",
                "主要任务": [
                    "生产环境配置",
                    "应用部署",
                    "监控配置",
                    "用户培训"
                ],
                "交付物": [
                    "部署文档",
                    "运维手册",
                    "用户手册"
                ]
            }
        }

    def calculate_total_duration(self):
        """计算总工期"""
        durations = {
            "需求分析": 2,
            "系统设计": 2,
            "开发实现": 6,
            "测试验证": 2,
            "部署上线": 1
        }

        total_weeks = sum(durations.values())
        return f"{total_weeks}周 ({total_weeks * 5}个工作日)"

    def generate_gantt_chart_data(self):
        """生成甘特图数据"""
        gantt_data = []
        start_week = 0

        for phase, details in self.phases.items():
            duration = {
                "需求分析": 2,
                "系统设计": 2,
                "开发实现": 6,
                "测试验证": 2,
                "部署上线": 1
            }[phase]

            gantt_data.append({
                "task": phase,
                "start": start_week,
                "duration": duration,
                "end": start_week + duration
            })

            start_week += duration

        return gantt_data

# 创建项目流程实例
project_flow = ProjectImplementationFlow()

print("=== 大数据可视化展板项目实施流程 ===\n")

for phase, details in project_flow.phases.items():
    print(f"📅 {phase} ({details['持续时间']})")
    print("-" * 40)

    print("主要任务:")
    for task in details['主要任务']:
        print(f"  • {task}")

    print("交付物:")
    for deliverable in details['交付物']:
        print(f"  📄 {deliverable}")

    print()

print(f"⏱️ 项目总工期: {project_flow.calculate_total_duration()}")

# 生成甘特图数据
gantt_data = project_flow.generate_gantt_chart_data()
print("\n📊 项目进度安排:")
for item in gantt_data:
    print(f"  {item['task']}: 第{item['start']+1}-{item['end']}周")
11.2 技术发展趋势
11.2.1 新兴技术趋势
# 技术发展趋势分析
class TechnologyTrends:
    """技术发展趋势"""

    def __init__(self):
        self.trends = self.analyze_trends()

    def analyze_trends(self):
        """分析技术趋势"""
        return {
            "前端技术发展": {
                "WebAssembly": {
                    "描述": "高性能Web应用的新标准",
                    "应用": "复杂数据处理、3D渲染、游戏开发",
                    "优势": ["接近原生性能", "多语言支持", "安全沙箱"],
                    "发展阶段": "快速发展期",
                    "预期影响": "将显著提升Web应用性能"
                },
                "Web Components": {
                    "描述": "原生组件化开发标准",
                    "应用": "可复用组件、跨框架组件库",
                    "优势": ["原生支持", "框架无关", "标准化"],
                    "发展阶段": "成熟期",
                    "预期影响": "推动组件化开发标准化"
                },
                "Progressive Web Apps": {
                    "描述": "渐进式Web应用",
                    "应用": "离线应用、移动端体验优化",
                    "优势": ["离线支持", "原生体验", "跨平台"],
                    "发展阶段": "快速普及期",
                    "预期影响": "模糊Web和原生应用边界"
                }
            },
            "可视化技术发展": {
                "WebGL 2.0": {
                    "描述": "下一代Web图形标准",
                    "应用": "3D可视化、复杂动画、游戏",
                    "优势": ["硬件加速", "高性能渲染", "丰富特效"],
                    "发展阶段": "普及期",
                    "预期影响": "推动Web 3D可视化发展"
                },
                "WebXR": {
                    "描述": "Web虚拟现实和增强现实",
                    "应用": "沉浸式数据可视化、虚拟展示",
                    "优势": ["沉浸体验", "无需安装", "跨设备"],
                    "发展阶段": "早期发展期",
                    "预期影响": "开创新的可视化体验"
                },
                "AI驱动可视化": {
                    "描述": "人工智能辅助的可视化生成",
                    "应用": "自动图表推荐、智能布局、异常检测",
                    "优势": ["智能化", "自动化", "个性化"],
                    "发展阶段": "快速发展期",
                    "预期影响": "降低可视化开发门槛"
                }
            },
            "数据处理技术": {
                "边缘计算": {
                    "描述": "在数据源附近进行计算处理",
                    "应用": "实时数据处理、减少延迟",
                    "优势": ["低延迟", "减少带宽", "提高安全性"],
                    "发展阶段": "快速发展期",
                    "预期影响": "改变数据处理架构"
                },
                "流式计算": {
                    "描述": "实时数据流处理技术",
                    "应用": "实时监控、事件驱动处理",
                    "优势": ["实时性", "高吞吐", "低延迟"],
                    "发展阶段": "成熟期",
                    "预期影响": "成为实时应用标准"
                },
                "联邦学习": {
                    "描述": "分布式机器学习技术",
                    "应用": "隐私保护、分布式训练",
                    "优势": ["隐私保护", "分布式", "协作学习"],
                    "发展阶段": "发展期",
                    "预期影响": "推动AI技术普及"
                }
            }
        }

    def predict_future_developments(self):
        """预测未来发展"""
        predictions = {
            "短期 (1-2年)": [
                "WebAssembly在数据可视化中的广泛应用",
                "AI辅助的自动化图表生成工具普及",
                "更好的移动端可视化体验",
                "实时协作功能成为标配",
                "无代码/低代码可视化平台兴起"
            ],
            "中期 (3-5年)": [
                "WebXR技术在数据可视化中的应用",
                "边缘计算驱动的实时可视化",
                "AI驱动的智能数据分析和可视化",
                "跨平台统一的可视化标准",
                "量子计算在大数据处理中的应用"
            ],
            "长期 (5-10年)": [
                "脑机接口在数据交互中的应用",
                "全息显示技术的普及",
                "自主学习的可视化系统",
                "完全沉浸式的数据环境",
                "人机协作的智能分析平台"
            ]
        }

        return predictions

    def generate_technology_roadmap(self):
        """生成技术路线图"""
        roadmap = {
            "核心技术演进": {
                "2024": ["WebAssembly普及", "AI辅助开发", "边缘计算应用"],
                "2025": ["WebXR初步应用", "量子计算探索", "5G网络优化"],
                "2026": ["全息显示技术", "脑机接口研究", "自主学习系统"],
                "2027": ["沉浸式体验普及", "智能协作平台", "跨现实交互"],
                "2028": ["完全智能化", "无缝人机交互", "自适应系统"]
            },
            "应用场景扩展": {
                "2024": ["智慧城市", "工业4.0", "金融科技"],
                "2025": ["元宇宙应用", "数字孪生", "自动驾驶"],
                "2026": ["太空探索", "生物医学", "环境监测"],
                "2027": ["教育培训", "娱乐体验", "社交网络"],
                "2028": ["全行业覆盖", "个人助手", "生活服务"]
            }
        }

        return roadmap

    def print_trends_analysis(self):
        """打印趋势分析"""
        print("=== 大数据可视化技术发展趋势分析 ===\n")

        for category, technologies in self.trends.items():
            print(f"🚀 {category}")
            print("=" * 50)

            for tech_name, details in technologies.items():
                print(f"\n📱 {tech_name}")
                print(f"描述: {details['描述']}")
                print(f"应用: {details['应用']}")
                print(f"发展阶段: {details['发展阶段']}")
                print(f"预期影响: {details['预期影响']}")

                print("优势:")
                for advantage in details['优势']:
                    print(f"  ✓ {advantage}")

                print("-" * 30)

            print()

        # 打印未来发展预测
        predictions = self.predict_future_developments()
        print("🔮 未来发展预测")
        print("=" * 50)

        for period, items in predictions.items():
            print(f"\n{period}:")
            for item in items:
                print(f"  • {item}")

        # 打印技术路线图
        roadmap = self.generate_technology_roadmap()
        print("\n🗺️ 技术发展路线图")
        print("=" * 50)

        for category, timeline in roadmap.items():
            print(f"\n{category}:")
            for year, technologies in timeline.items():
                print(f"  {year}: {', '.join(technologies)}")

# 创建趋势分析实例
trends_analyzer = TechnologyTrends()
trends_analyzer.print_trends_analysis()
11.2.2 学习建议与职业发展
# 学习建议与职业发展指南
class CareerDevelopmentGuide:
"""职业发展指南"""
def __init__(self):
self.learning_paths = self.define_learning_paths()
self.career_levels = self.define_career_levels()
def define_learning_paths(self):
"""定义学习路径"""
return {
"初级开发者": {
"学习目标": "掌握基础技能,能够独立完成简单项目",
"核心技能": [
"HTML5/CSS3基础",
"JavaScript ES6+",
"基础图表库使用",
"响应式设计",
"版本控制(Git)"
],
"学习资源": [
"MDN Web文档",
"ECharts官方文档",
"JavaScript高级程序设计",
"CSS权威指南",
"在线编程平台练习"
],
"实践项目": [
"个人作品集网站",
"简单数据展示页面",
"响应式图表组件",
"基础交互功能"
],
"学习周期": "3-6个月"
},
"中级开发者": {
"学习目标": "具备项目开发能力,掌握进阶技术",
"核心技能": [
"前端框架(Vue/React)",
"状态管理",
"模块化开发",
"性能优化",
"测试技术"
],
"学习资源": [
"Vue.js/React官方文档",
"前端性能优化指南",
"JavaScript设计模式",
"Web性能权威指南",
"开源项目源码学习"
],
"实践项目": [
"完整的数据可视化平台",
"实时监控系统",
"多页面应用开发",
"组件库开发"
],
"学习周期": "6-12个月"
},
"高级开发者": {
"学习目标": "具备架构设计能力,引领技术发展",
"核心技能": [
"系统架构设计",
"微前端架构",
"性能调优",
"团队协作",
"技术选型"
],
"学习资源": [
"系统设计相关书籍",
"架构模式文档",
"技术会议和论文",
"开源项目贡献",
"技术博客写作"
],
"实践项目": [
"大型可视化平台架构",
"开源项目维护",
"技术团队管理",
"技术方案设计"
],
"学习周期": "持续学习"
}
}
def define_career_levels(self):
"""定义职业等级"""
return {
"前端开发工程师": {
"职责": "负责前端页面开发和用户交互实现",
"技能要求": [
"熟练掌握HTML/CSS/JavaScript",
"熟悉至少一种前端框架",
"了解浏览器兼容性",
"具备基础的设计审美"
],
"薪资范围": "8K-20K",
"发展方向": ["高级前端工程师", "全栈工程师"]
},
"数据可视化工程师": {
"职责": "专注于数据可视化技术和图表开发",
"技能要求": [
"精通可视化库和工具",
"具备数据分析能力",
"了解设计原理",
"掌握数据处理技术"
],
"薪资范围": "12K-25K",
"发展方向": ["高级可视化工程师", "数据科学家"]
},
"前端架构师": {
"职责": "负责前端技术架构设计和技术选型",
"技能要求": [
"深入理解前端技术栈",
"具备系统设计能力",
"拥有团队管理经验",
"关注技术发展趋势"
],
"薪资范围": "25K-50K",
"发展方向": ["技术总监", "CTO"]
},
"产品经理": {
"职责": "负责产品规划和需求管理",
"技能要求": [
"理解用户需求",
"具备产品思维",
"了解技术实现",
"拥有沟通协调能力"
],
"薪资范围": "15K-35K",
"发展方向": ["高级产品经理", "产品总监"]
}
}
def create_learning_plan(self, current_level, target_level, timeframe):
"""创建学习计划"""
plan = {
"学习目标": f"从{current_level}提升到{target_level}",
"时间框架": timeframe,
"学习阶段": [],
"里程碑": [],
"评估标准": []
}
if current_level == "初级" and target_level == "中级":
plan["学习阶段"] = [
{
"阶段": "基础巩固 (1-2个月)",
"内容": ["深入学习JavaScript", "掌握CSS高级特性", "熟悉开发工具"]
},
{
"阶段": "框架学习 (2-3个月)",
"内容": ["选择并深入学习一个前端框架", "理解组件化开发", "学习状态管理"]
},
{
"阶段": "项目实践 (2-3个月)",
"内容": ["完成中等复杂度项目", "学习性能优化", "掌握测试技术"]
}
]
plan["里程碑"] = [
"完成个人项目作品集",
"掌握一个主流前端框架",
"能够独立完成中等复杂度项目",
"具备基础的性能优化能力"
]
plan["评估标准"] = [
"能够快速搭建项目架构",
"代码质量和规范性",
"问题解决能力",
"学习新技术的能力"
]
return plan
def generate_skill_matrix(self):
"""生成技能矩阵"""
skills = {
"前端基础": {
"HTML/CSS": ["语义化标签", "Flexbox/Grid", "CSS预处理器", "响应式设计"],
"JavaScript": ["ES6+语法", "异步编程", "模块化", "函数式编程"],
"浏览器": ["DOM操作", "事件处理", "性能优化", "兼容性处理"]
},
"可视化技术": {
"图表库": ["ECharts", "D3.js", "Chart.js", "Three.js"],
"地图技术": ["百度地图", "高德地图", "Leaflet", "Mapbox"],
"数据处理": ["数据清洗", "格式转换", "实时更新", "缓存策略"]
},
"工程化": {
"构建工具": ["Webpack", "Vite", "Rollup", "Parcel"],
"版本控制": ["Git", "GitHub", "GitLab", "代码审查"],
"测试": ["单元测试", "集成测试", "E2E测试", "性能测试"]
},
"软技能": {
"沟通协作": ["团队合作", "需求理解", "技术分享", "文档编写"],
"学习能力": ["自主学习", "技术调研", "问题解决", "创新思维"],
"项目管理": ["时间管理", "风险控制", "质量保证", "进度跟踪"]
}
}
return skills
def print_career_guide(self):
"""打印职业发展指南"""
print("=== 大数据可视化开发职业发展指南 ===\n")
# 打印学习路径
print("📚 学习路径")
print("=" * 50)
for level, details in self.learning_paths.items():
print(f"\n🎯 {level}")
print(f"学习目标: {details['学习目标']}")
print(f"学习周期: {details['学习周期']}")
print("核心技能:")
for skill in details['核心技能']:
print(f" • {skill}")
print("推荐资源:")
for resource in details['学习资源']:
print(f" 📖 {resource}")
print("实践项目:")
for project in details['实践项目']:
print(f" 🚀 {project}")
print("-" * 40)
# 打印职业等级
print("\n💼 职业发展路径")
print("=" * 50)
for position, details in self.career_levels.items():
print(f"\n👨💻 {position}")
print(f"职责: {details['职责']}")
print(f"薪资范围: {details['薪资范围']}")
print("技能要求:")
for skill in details['技能要求']:
print(f" ✓ {skill}")
print("发展方向:")
for direction in details['发展方向']:
print(f" ➡️ {direction}")
print("-" * 40)
# 打印技能矩阵
skills = self.generate_skill_matrix()
print("\n🎯 技能发展矩阵")
print("=" * 50)
for category, skill_groups in skills.items():
print(f"\n{category}:")
for group, skills_list in skill_groups.items():
print(f" {group}: {', '.join(skills_list)}")
# 打印学习建议
print("\n💡 学习建议")
print("=" * 50)
suggestions = [
"制定明确的学习目标和时间计划",
"理论学习与实践项目相结合",
"积极参与开源项目和技术社区",
"定期总结和分享学习成果",
"关注行业发展趋势和新技术",
"培养解决问题的思维方式",
"建立个人技术品牌和影响力",
"保持持续学习的习惯"
]
for i, suggestion in enumerate(suggestions, 1):
print(f" {i}. {suggestion}")
# 创建职业发展指南
career_guide = CareerDevelopmentGuide()
career_guide.print_career_guide()
# 创建个性化学习计划示例
print("\n=== 个性化学习计划示例 ===")
learning_plan = career_guide.create_learning_plan("初级", "中级", "6个月")
print(f"学习目标: {learning_plan['学习目标']}")
print(f"时间框架: {learning_plan['时间框架']}")
print("\n学习阶段:")
for stage in learning_plan['学习阶段']:
print(f" {stage['阶段']}:")
for content in stage['内容']:
print(f" - {content}")
print("\n关键里程碑:")
for milestone in learning_plan['里程碑']:
print(f" ✓ {milestone}")
print("\n评估标准:")
for criterion in learning_plan['评估标准']:
print(f" 📊 {criterion}")
11.3 结语
大数据可视化展板作为数字化时代的重要工具,正在各行各业发挥着越来越重要的作用。通过本文的系统性介绍,我们不仅掌握了技术实现的核心要点,更重要的是建立了完整的知识体系和实践方法论。
11.3.1 核心价值总结
11.3.2 持续学习的重要性
在快速发展的技术领域,持续学习是保持竞争力的关键。我们需要:
- 保持技术敏感度:关注新技术发展,及时更新知识体系
- 注重实践应用:将理论知识转化为实际项目经验
- 培养系统思维:从全局角度思考问题和解决方案
- 建立技术网络:与同行交流,分享经验和最佳实践
11.3.3 未来展望
随着人工智能、物联网、5G等技术的快速发展,大数据可视化展板将迎来更多机遇和挑战:
- 智能化程度不断提升:AI将在数据分析、图表推荐、异常检测等方面发挥更大作用
- 交互体验持续优化:VR/AR技术将带来全新的沉浸式体验
- 实时性要求越来越高:边缘计算和5G网络将支持更低延迟的实时处理
- 个性化需求日益增长:系统将更好地适应不同用户的需求和偏好
让我们携手共进,在大数据可视化的道路上不断探索、创新和成长,为构建更智能、更美好的数字世界贡献自己的力量!
12. 参考资料
12.1 官方文档
- ECharts官方文档 - Apache ECharts可视化库官方文档
- MDN Web文档 - Web技术权威参考文档
- Vue.js官方文档 - Vue.js框架官方指南
- React官方文档 - React框架官方文档
- D3.js官方文档 - D3.js数据驱动文档库
12.2 技术书籍
- 《JavaScript高级程序设计》- Nicholas C. Zakas
- 《CSS权威指南》- Eric A. Meyer
- 《数据可视化实战》- Scott Murray
- 《Web性能权威指南》- Ilya Grigorik
- 《前端架构设计》- Micah Godbolt
12.3 在线资源
- GitHub - 开源代码托管平台
- Stack Overflow - 程序员问答社区
- CodePen - 前端代码演示平台
- Can I Use - 浏览器兼容性查询
- npm - Node.js包管理器
12.4 学习平台
12.5 工具资源
- Visual Studio Code - 代码编辑器
- Chrome DevTools - 浏览器开发者工具
- Figma - UI设计工具
- Postman - API测试工具
- Git - 版本控制系统


 被折叠的 条评论
为什么被折叠?
被折叠的 条评论
为什么被折叠?
 到【灌水乐园】发言


