缺少渲染器后端
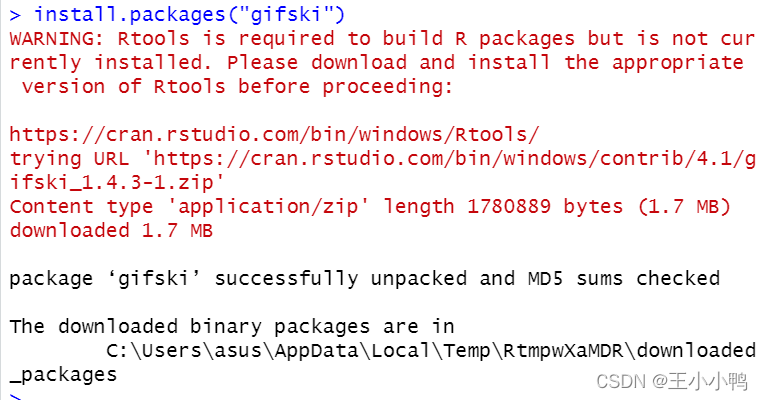
No renderer backend detected. gganimate will default to writing frames to separate filesconsider installing: 没有检测到渲染器后端。默认情况下,gganimateWill 会编写框架以分离文件,考虑安装installing:
- the `gifski` package for gif output- the av` package for video outputand restarting the R session -gif输出的“gifski”包-用于视频输出和重新启动R会话的ava包
解决
install.packages("Cairo")

install.packages("gifski")

gganimate出现The animation object does not specify a save_animation method错误

warning message: 警告信息:
file_renderer failed to copy frames to the destination directory
( File_renderer未能将帧复制到目标目录
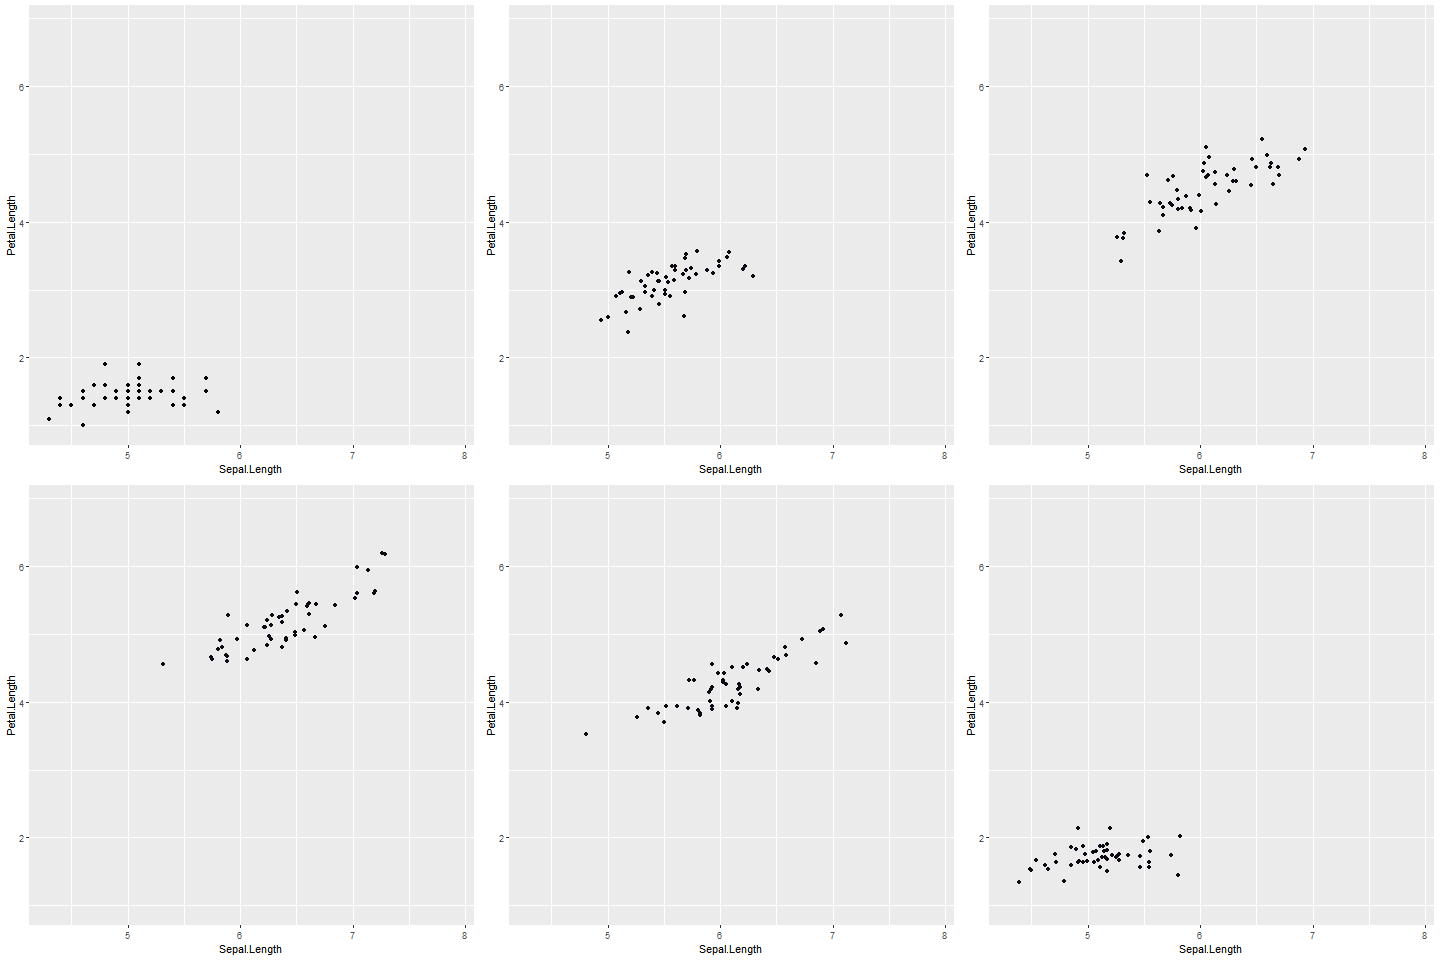
首先,安装gifski包,然后在下面键入代码,我添加了另一行。注意,+过渡期_状态(物种)是第一行的一部分,以生成一个p。
p <- ggplot(iris, aes(Sepal.Length, Petal.Length)) +
geom_point()+
transition_states(Species)

animate(p, renderer = gifski_renderer())

成果:

Error in print.defau1t() : argument "x" is missing,with no defau1t># save at gif:
在print.defau1t():参数“x”中缺少错误,在gif处没有Defau1t>#Save:
>anim_save("288-animated-barplot-transition.gif") >anim_save(“288-animated-barplot-transition.gif”)
Error: The animation object does not specify a save_animation method
错误:动画对象没有指定保存动画方法
找遍各个地方都没找到解决方法,
又是安装gifski,又是设置管理员启动,连Stack Overflow上的方法都试过也不行‘
最后在gganimate的Github的issue上找到了解决办法
解决方法说起来其实挺离谱的,就是需要在anim_save("test.gif")前先加一句print()输出一下做的图
虽然根本打印不出来,但至少能把gif保存到工作目录了
而且保存可能会出一些问题,比如file_renderer failed to copy frames to the destination directory,
这个问题试着把RStudio用管理员权限打开
但是没用,管理员权限打开也没用,唉。
if(!require(gapminder)){
install.packages("gapminder")
}
# 获取数据:
library(gapminder)
# 绘图包
library(ggplot2)
# 动画包
library(gganimate)
# 用ggplot作图, 添加 frame=year
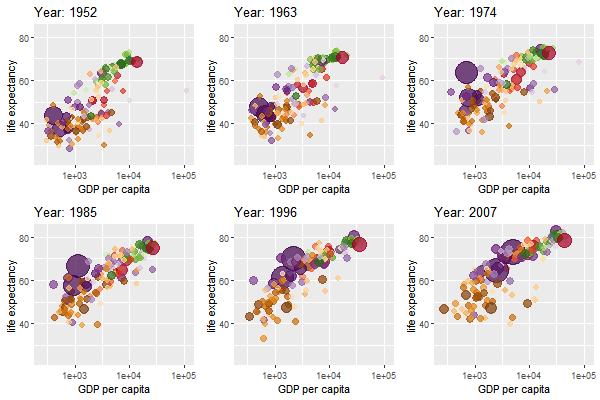
test <- ggplot(gapminder, aes(gdpPercap, lifeExp, size = pop, color = continent)) +
geom_point() +
scale_x_log10() +
theme_bw() +
# 在这里
labs(title = 'Year: {frame_time}', x = 'GDP per capita', y = 'life expectancy') +
transition_time(year) +
ease_aes('linear')print()
# 保存为GIF:
print()
anim_save("271-ggplot2-animated-gif-chart-with-gganimate1.gif")
R3成品:
library(gapminder)
> library(gganimate)
> library(gifski)
>
> ## standard ggplot2
> myPlot <- ggplot(gapminder, aes(gdpPercap, lifeExp, size = pop, colour = country)) +
+     geom_point(alpha = 0.7, show.legend = FALSE) +
+     scale_colour_manual(values = country_colors) +
+     scale_size(range = c(2, 12)) +
+     scale_x_log10() +
+     # Here comes the gganimate specific bits
+     labs(title = 'Year: {frame_time}', x = 'GDP per capita', y = 'life expectancy') +
+     transition_time(year) +
+     ease_aes('linear')
>
> animate(myPlot, duration = 5, fps = 20, width = 200, height = 200, renderer = gifski_renderer())

Inserting image 100 at 4.95s (100%)...
Encoding to gif... done!
> anim_save("output.gif")

 gganimate动画问题解决


 本文介绍了使用gganimate包时遇到的动画无法正确保存的问题及解决方案。通过安装必要的包如Cairo和gifski,并使用特定的代码片段,可以解决Theanimationobjectdoesnotspecifyasave_animationmethod错误。


 614
614

 被折叠的 条评论
为什么被折叠?


