


 本文介绍了如何使用matplotlib库绘制散点图及Series的plot方法绘制折线图,并展示了如何设置图表的轴标签、图例和标题。
3、 数据的可视化展示1-散点图。用matplotlib库来实现数据的可视化展示。其中,散点图用scatter方法。matplotlib.pyplot.scatter(x, y, s=20, c='b', marker='o', cmap=None, norm=None, vmin=None, vmax=None, alpha=None,linewidths=None, verts=None, hold=None, **kwargs),其中x,y为等长的数组序列,其它参数可忽略。
下面是实现散点图的代码:
fig1=plt.scatter(df['volume'],df['closeing'])
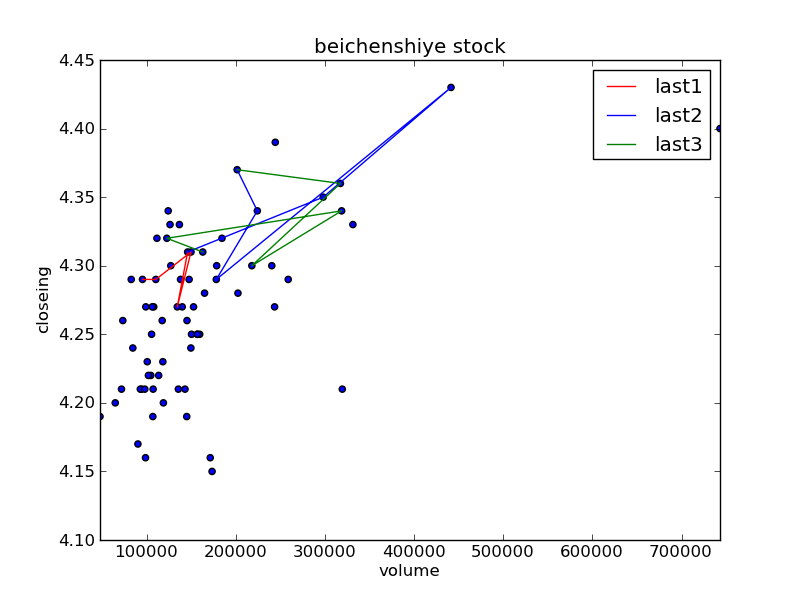
4、 数据的可视化展示2-折线图。用Series的plot方法实现。
下面是实现折线图的代码:
fig1=srs1.plot(use_index=True,xlim=[df['volume'].min(),df['volume'].max()],color='r',label='last1')
fig1=srs2.plot(use_index=True,xlim=[df['volume'].min(),df['volume'].max()],color='b',label='last2')
fig1=srs3.plot(use_index=True,xlim=[df['volume'].min(),df['volume'].max()],color='g',label='last3')
5、设置轴标签、图例和标题
代码如下:
#添加标题和图例
fig1.set_xlabel('volume')
fig1.set_ylabel('closeing')
fig1.set_title('beichenshiye stock')
fig1.legend(loc='best')


 被折叠的 条评论
为什么被折叠?
被折叠的 条评论
为什么被折叠?
 到【灌水乐园】发言


