


普罗米修斯
搭建
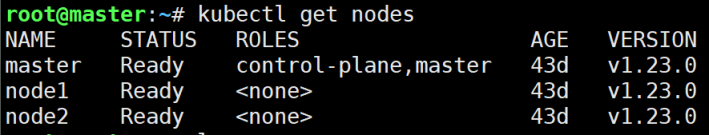
# 检查节点状态,查看K8s版本
kubectl get nodes
# 1.环境准备和快速部署脚本
vim setup-prometheus-ha.sh
---------------------------------===========================
#!/bin/bash
# setup-prometheus-ha.sh
echo "=== 开始部署高可用Prometheus集群 ==="
# 创建监控命名空间
kubectl create namespace monitoring
echo "1. 在Node节点创建存储目录..."
# 在node节点创建目录(需要ssh访问权限)
for node in 192.168.221.22 192.168.221.23; do
echo "在节点 $node 创建存储目录..."
ssh root@$node "sudo mkdir -p /data/prometheus-data && sudo chmod 777 /data/prometheus-data" 2>/dev/null || echo "无法访问节点 $node,请手动创建目录"
done
----------------------------------===========================
# 2.创建配置文件(合并)
vim prometheus-full.yaml
文件无效,稍等++++++++++
# 3.一键部署脚本
vim deploy-prometheus.sh
----------------------------===============================
#!/bin/bash
# deploy-prometheus.sh
echo "=== K8s 1.23 高可用Prometheus部署脚本 ==="
echo "Master节点: 192.168.221.21"
echo "Node节点: 192.168.221.22, 192.168.221.23"
echo ""
# 创建命名空间
echo "1. 创建monitoring命名空间..."
kubectl create namespace monitoring 2>/dev/null || echo "命名空间已存在"
# 部署所有配置
echo "2. 部署Prometheus所有组件..."
kubectl apply -f prometheus-full.yaml
echo "3. 等待Pod启动(30秒)..."
sleep 30
# 检查部署状态
echo "4. 检查部署状态:"
echo "================================"
kubectl get pods -n monitoring -o wide
echo ""
kubectl get svc -n monitoring
echo ""
kubectl get pv -n monitoring
echo "================================"
# 验证访问
echo "5. 访问信息:"
echo "内部访问: kubectl port-forward -n monitoring svc/prometheus 9090:9090"
echo "外部访问: http://192.168.221.21:30090"
echo "外部访问: http://192.168.221.22:30090"
echo "外部访问: http://192.168.221.23:30090"
echo ""
echo "6. 验证命令:"
echo "查看日志: kubectl logs -n monitoring prometheus-0 --tail=10"
echo "查看日志: kubectl logs -n monitoring prometheus-1 --tail=10"
echo "测试高可用: kubectl delete pod -n monitoring prometheus-0"
echo ""
echo "部署完成!��"
--------------------------------==========================
# 4.卸载脚本(用不到,但可以留着)
vim uninstall-prometheus.sh
#!/bin/bash
# uninstall-prometheus.sh
echo "卸载Prometheus部署..."
kubectl delete -f prometheus-full.yaml 2>/dev/null
kubectl delete namespace monitoring 2>/dev/null
echo "清理本地存储目录..."
ssh root@192.168.221.22 "sudo rm -rf /data/prometheus-data" 2>/dev/null || true
ssh root@192.168.221.23 "sudo rm -rf /data/prometheus-data" 2>/dev/null || true
echo "卸载完成!"
----------------------------------========================
# 5.验证和管理命令
vim verify-prometheus.sh
-----------------------------==============================
#!/bin/bash
# verify-prometheus.sh
echo "1. 查看Pod状态:"
kubectl get pods -n monitoring -w
echo ""
echo "2. 查看服务:"
kubectl get svc -n monitoring
echo ""
echo "3. 检查数据持久化:"
kubectl exec -n monitoring prometheus-0 -- ls -la /prometheus/wal
echo ""
echo "4. 查看资源配置:"
kubectl describe sts prometheus -n monitoring
echo ""
echo "5. 快速访问(需要在master节点运行):"
echo "启动端口转发: kubectl port-forward -n monitoring svc/prometheus 9090:9090"
echo "然后在浏览器访问: http://localhost:9090"
--------------------------------==========================
# 6.使用配置文件
#(1)下载配置文件
curl -O https://raw.githubusercontent.com/your-repo/prometheus-full.yaml
#(2)给执行权限
chmod +x setup-prometheus-ha.sh
chmod +x deploy-prometheus.sh
#(3)设置存储目录(如果需要)
./setup-prometheus-ha.sh
#(4)一键部署
./deploy-prometheus.sh
#(5)访问验证
浏览器访问: http://192.168.221.21:30090
此处有问题
## 此时如果浏览器显示拒绝连接,可能是Pod问题,端口问题
用kubectl get pods -n monitoring查看Pod是否Running
如果没有,用kubectl describe pod -n monitoring找出具体原因
# 解决方法一:快速修复脚本
#!/bin/bash
# fix-prometheus.sh
echo "=== 修复Prometheus访问问题 ==="
# 清理之前的部署
echo "1. 清理旧部署..."
kubectl delete -f prometheus-full.yaml 2>/dev/null || true
sleep 10
# 禁用防火墙(测试环境)
echo "2. 配置防火墙..."
for node in 192.168.221.21 192.168.221.22 192.168.221.23; do
echo "配置节点 $node ..."
ssh root@$node << 'EOF'
sudo ufw allow 30090/tcp
sudo ufw allow 9090/tcp
sudo ufw reload
EOF
done
# 使用修复版配置
echo "3. 部署修复版配置..."
kubectl apply -f prometheus-fixed.yaml
echo "4. 等待启动..."
sleep 20
echo "5. 测试访问..."
# 方法1:使用端口转发(最可靠)
echo "启动端口转发..."
kubectl port-forward -n monitoring svc/prometheus 9090:9090 --address='0.0.0.0' &
PORT_FORWARD_PID=$!
echo "端口转发已启动,PID: $PORT_FORWARD_PID"
echo "现在可以通过以下方式访问:"
echo "1. 端口转发: http://192.168.221.21:9090"
echo "2. NodePort: http://192.168.221.21:30090"
# 测试连接
sleep 5
echo "测试连接..."
curl -s http://192.168.221.21:9090 | grep -i prometheus || echo "直接访问失败,尝试其他方法..."
echo ""
echo "如果还是无法访问,请检查:"
echo "1. Pod状态: kubectl get pods -n monitoring"
echo "2. 服务状态: kubectl get svc -n monitoring"
echo "3. Pod日志: kubectl logs -n monitoring deploy/prometheus"
# 解决方法二:最简普罗米修斯
#!/bin/bash
# simple-prometheus.sh
echo "=== 最简Prometheus部署方案 ==="
# 创建命名空间
kubectl create namespace monitoring --dry-run=client -o yaml | kubectl apply -f -
# 部署单节点Prometheus(不追求高可用)
cat <<EOF | kubectl apply -f -
apiVersion: apps/v1
kind: Deployment
metadata:
name: prometheus
namespace: monitoring
spec:
replicas: 1
selector:
matchLabels:
app: prometheus
template:
metadata:
labels:
app: prometheus
spec:
containers:
- name: prometheus
image: prom/prometheus:latest
args:
- "--config.file=/etc/prometheus/prometheus.yml"
- "--storage.tsdb.path=/prometheus"
- "--web.enable-lifecycle"
ports:
- containerPort: 9090
volumeMounts:
- name: config
mountPath: /etc/prometheus
volumes:
- name: config
configMap:
name: prometheus-config
---
apiVersion: v1
kind: ConfigMap
metadata:
name: prometheus-config
namespace: monitoring
data:
prometheus.yml: |
global:
scrape_interval: 15s
scrape_configs:
- job_name: 'prometheus'
static_configs:
- targets: ['localhost:9090']
---
apiVersion: v1
kind: Service
metadata:
name: prometheus
namespace: monitoring
spec:
type: NodePort
selector:
app: prometheus
ports:
- port: 9090
targetPort: 9090
nodePort: 30091 # 使用不同端口避免冲突
EOF
echo "等待部署完成..."
sleep 15
# 使用端口转发确保可以访问
echo "启动端口转发..."
kubectl port-forward -n monitoring svc/prometheus 9090:9090 --address='192.168.221.21' &
echo ""
echo "现在可以通过以下方式访问:"
echo "1. http://192.168.221.21:9090 (端口转发)"
echo "2. http://192.168.221.21:30091 (NodePort)"
echo ""
echo "按 Ctrl+C 停止端口转发"
wait
-----------------------------===============================
解决方法三:使用现有的Nginx镜像做端口转发
vim nginx-proxy-solution.sh
-------------------------=============================
#!/bin/bash
# nginx-proxy-solution.sh
echo "=== 使用nginx作为代理的临时方案 ==="
# 先确保有nginx镜像
ssh node1 "docker pull nginx:alpine"
cat <<'EOF' | kubectl apply -f -
apiVersion: v1
kind: ConfigMap
metadata:
name: nginx-prometheus-config
namespace: monitoring
data:
nginx.conf: |
events {
worker_connections 1024;
}
http {
server {
listen 9090;
location / {
# 这里可以代理到其他监控服务
# 暂时返回静态页面
return 200 '{
"status": "prometheus_not_available",
"message": "Prometheus deployment in progress",
"alternatives": [
"访问 http://192.168.221.21:30080 获取节点指标",
"使用 kubectl top nodes 查看资源使用"
]
}';
add_header Content-Type application/json;
}
location /metrics {
# 模拟Prometheus metrics端点
return 200 '# HELP dummy_metric A dummy metric
# TYPE dummy_metric gauge
dummy_metric 1
# HELP k8s_cluster_status Kubernetes cluster status
# TYPE k8s_cluster_status gauge
k8s_cluster_status{cluster="k8s-1.23"} 1';
add_header Content-Type text/plain;
}
}
}
---
apiVersion: apps/v1
kind: Deployment
metadata:
name: nginx-prometheus-proxy
namespace: monitoring
spec:
replicas: 1
selector:
matchLabels:
app: nginx-prometheus-proxy
template:
metadata:
labels:
app: nginx-prometheus-proxy
spec:
containers:
- name: nginx
image: nginx:alpine # 这个镜像肯定能拉取
ports:
- containerPort: 9090
volumeMounts:
- name: config
mountPath: /etc/nginx/nginx.conf
subPath: nginx.conf
volumes:
- name: config
configMap:
name: nginx-prometheus-config
---
apiVersion: v1
kind: Service
metadata:
name: nginx-prometheus-proxy
namespace: monitoring
spec:
type: NodePort
selector:
app: nginx-prometheus-proxy
ports:
- port: 9090
targetPort: 9090
nodePort: 30090
EOF
echo "部署完成!"
echo "现在可以访问: http://192.168.221.21:30090"
echo "至少有个可用的端点,然后再慢慢解决Prometheus镜像问题"
----------------------------==============================
# 执行这个最简单的方案,至少能看到页面
chmod +x nginx-proxy-solution.sh
./nginx-proxy-solution.sh
# 检查是否运行
kubectl get pods -n monitoring
kubectl get svc -n monitoring
# 访问测试
curl http://192.168.221.21:30090
# 部署完整的监控套件
步骤1:部署Node Exporter(获取节点指标)
vim node-exporter.yaml
----------------------======================
apiVersion: apps/v1
kind: DaemonSet
metadata:
name: node-exporter
namespace: monitoring
labels:
k8s-app: node-exporter
spec:
selector:
matchLabels:
k8s-app: node-exporter
template:
metadata:
labels:
k8s-app: node-exporter
spec:
hostNetwork: true
hostPID: true
tolerations:
- effect: NoSchedule
operator: Exists
containers:
- name: node-exporter
image: prom/node-exporter:v1.6.0
args:
- --path.procfs=/host/proc
- --path.sysfs=/host/sys
- --path.rootfs=/host/root
ports:
- containerPort: 9100
hostPort: 9100
resources:
requests:
cpu: 100m
memory: 100Mi
limits:
cpu: 200m
memory: 200Mi
volumeMounts:
- name: proc
mountPath: /host/proc
readOnly: true
- name: sys
mountPath: /host/sys
readOnly: true
- name: root
mountPath: /host/root
readOnly: true
volumes:
- name: proc
hostPath:
path: /proc
- name: sys
hostPath:
path: /sys
- name: root
hostPath:
path: /
---
apiVersion: v1
kind: Service
metadata:
name: node-exporter
namespace: monitoring
labels:
k8s-app: node-exporter
spec:
selector:
k8s-app: node-exporter
ports:
- name: metrics
port: 9100
targetPort: 9100
步骤2:部署Kube State Metrics(获取K8s资源指标)
vim kube-state-metrics.yaml
---------------------=============================
apiVersion: apps/v1
kind: Deployment
metadata:
name: kube-state-metrics
namespace: monitoring
spec:
replicas: 1
selector:
matchLabels:
app: kube-state-metrics
template:
metadata:
labels:
app: kube-state-metrics
spec:
serviceAccountName: kube-state-metrics
containers:
- name: kube-state-metrics
image: registry.cn-hangzhou.aliyuncs.com/google_containers/kube-state-metrics:v2.9.2
ports:
- containerPort: 8080
resources:
requests:
cpu: 10m
memory: 64Mi
limits:
cpu: 100m
memory: 256Mi
---
apiVersion: v1
kind: ServiceAccount
metadata:
name: kube-state-metrics
namespace: monitoring
---
apiVersion: rbac.authorization.k8s.io/v1
kind: ClusterRole
metadata:
name: kube-state-metrics
rules:
- apiGroups: [""]
resources: ["nodes", "pods", "services", "resourcequotas", "replicationcontrollers", "limitranges", "persistentvolumeclaims", "persistentvolumes", "namespaces", "endpoints", "configmaps", "secrets"]
verbs: ["list", "watch"]
- apiGroups: ["extensions"]
resources: ["daemonsets", "deployments", "replicasets", "ingresses"]
verbs: ["list", "watch"]
- apiGroups: ["apps"]
resources: ["statefulsets", "daemonsets", "deployments", "replicasets"]
verbs: ["list", "watch"]
- apiGroups: ["batch"]
resources: ["cronjobs", "jobs"]
verbs: ["list", "watch"]
- apiGroups: ["autoscaling"]
resources: ["horizontalpodautoscalers"]
verbs: ["list", "watch"]
- apiGroups: ["policy"]
resources: ["poddisruptionbudgets"]
verbs: ["list", "watch"]
- apiGroups: ["certificates.k8s.io"]
resources: ["certificatesigningrequests"]
verbs: ["list", "watch"]
- apiGroups: ["storage.k8s.io"]
resources: ["storageclasses", "volumeattachments"]
verbs: ["list", "watch"]
- apiGroups: ["admissionregistration.k8s.io"]
resources: ["mutatingwebhookconfigurations", "validatingwebhookconfigurations"]
verbs: ["list", "watch"]
- apiGroups: ["networking.k8s.io"]
resources: ["networkpolicies", "ingresses"]
verbs: ["list", "watch"]
- apiGroups: ["coordination.k8s.io"]
resources: ["leases"]
verbs: ["list", "watch"]
---
apiVersion: rbac.authorization.k8s.io/v1
kind: ClusterRoleBinding
metadata:
name: kube-state-metrics
roleRef:
apiGroup: rbac.authorization.k8s.io
kind: ClusterRole
name: kube-state-metrics
subjects:
- kind: ServiceAccount
name: kube-state-metrics
namespace: monitoring
---
apiVersion: v1
kind: Service
metadata:
name: kube-state-metrics
namespace: monitoring
spec:
selector:
app: kube-state-metrics
ports:
- name: http-metrics
port: 8080
targetPort: 8080
- name: telemetry
port: 8081
targetPort: 8081
步骤3:更新Prometheus配置以监控这些目标
vim 03-prometheus-config-updated.yaml
-----------------------------==============================
# prometheus-config-updated.yaml
apiVersion: v1
kind: ConfigMap
metadata:
name: prometheus-config
namespace: monitoring
data:
prometheus.yml: |
global:
scrape_interval: 15s
evaluation_interval: 15s
scrape_configs:
# 监控Prometheus自身
- job_name: 'prometheus'
static_configs:
- targets: ['localhost:9090']
# 监控Node Exporter
- job_name: 'node-exporter'
kubernetes_sd_configs:
- role: endpoints
relabel_configs:
- source_labels: [__meta_kubernetes_endpoints_name]
regex: 'node-exporter'
action: keep
# 监控Kube State Metrics
- job_name: 'kube-state-metrics'
kubernetes_sd_configs:
- role: endpoints
relabel_configs:
- source_labels: [__meta_kubernetes_endpoints_name]
regex: 'kube-state-metrics'
action: keep
# 监控Kubernetes API Server
- job_name: 'kubernetes-apiservers'
kubernetes_sd_configs:
- role: endpoints
scheme: https
tls_config:
ca_file: /var/run/secrets/kubernetes.io/serviceaccount/ca.crt
bearer_token_file: /var/run/secrets/kubernetes.io/serviceaccount/token
relabel_configs:
- source_labels: [__meta_kubernetes_namespace, __meta_kubernetes_service_name, __meta_kubernetes_endpoint_port_name]
action: keep
regex: default;kubernetes;https
# 监控Kubernetes节点
- job_name: 'kubernetes-nodes'
scheme: https
tls_config:
ca_file: /var/run/secrets/kubernetes.io/serviceaccount/ca.crt
bearer_token_file: /var/run/secrets/kubernetes.io/serviceaccount/token
kubernetes_sd_configs:
- role: node
relabel_configs:
- action: labelmap
regex: __meta_kubernetes_node_label_(.+)
- target_label: __address__
replacement: kubernetes.default.svc:443
- source_labels: [__meta_kubernetes_node_name]
regex: (.+)
target_label: __metrics_path__
replacement: /api/v1/nodes/${1}/proxy/metrics
# 监控Kubernetes Pods
- job_name: 'kubernetes-pods'
kubernetes_sd_configs:
- role: pod
relabel_configs:
- source_labels: [__meta_kubernetes_pod_annotation_prometheus_io_scrape]
action: keep
regex: true
- source_labels: [__meta_kubernetes_pod_annotation_prometheus_io_path]
action: replace
target_label: __metrics_path__
regex: (.+)
- source_labels: [__address__, __meta_kubernetes_pod_annotation_prometheus_io_port]
action: replace
regex: ([^:]+)(?::\d+)?;(\d+)
replacement: $1:$2
target_label: __address__
- action: labelmap
regex: __meta_kubernetes_pod_label_(.+)
- source_labels: [__meta_kubernetes_namespace]
action: replace
target_label: namespace
- source_labels: [__meta_kubernetes_pod_name]
action: replace
target_label: pod_name
# 监控Kubernetes cAdvisor(容器指标)
- job_name: 'kubernetes-cadvisor'
scheme: https
tls_config:
ca_file: /var/run/secrets/kubernetes.io/serviceaccount/ca.crt
bearer_token_file: /var/run/secrets/kubernetes.io/serviceaccount/token
kubernetes_sd_configs:
- role: node
relabel_configs:
- action: labelmap
regex: __meta_kubernetes_node_label_(.+)
- target_label: __address__
replacement: kubernetes.default.svc:443
- source_labels: [__meta_kubernetes_node_name]
regex: (.+)
target_label: __metrics_path__
replacement: /api/v1/nodes/${1}/proxy/metrics/cadvisor
# 监控Kubernetes服务端点
- job_name: 'kubernetes-service-endpoints'
kubernetes_sd_configs:
- role: endpoints
relabel_configs:
- source_labels: [__meta_kubernetes_service_annotation_prometheus_io_scrape]
action: keep
regex: true
- source_labels: [__meta_kubernetes_service_annotation_prometheus_io_scheme]
action: replace
target_label: __scheme__
regex: (https?)
- source_labels: [__meta_kubernetes_service_annotation_prometheus_io_path]
action: replace
target_label: __metrics_path__
regex: (.+)
- source_labels: [__address__, __meta_kubernetes_service_annotation_prometheus_io_port]
action: replace
regex: ([^:]+)(?::\d+)?;(\d+)
replacement: $1:$2
target_label: __address__
- action: labelmap
regex: __meta_kubernetes_service_label_(.+)
- source_labels: [__meta_kubernetes_namespace]
action: replace
target_label: namespace
- source_labels: [__meta_kubernetes_service_name]
action: replace
target_label: service_name
-------------------------------==========================
# 一键部署完整监控
vim deploy-full-monitoring.sh
------------------------------===========================
#!/bin/bash
echo "=== 部署完整监控体系 ==="
echo "1. 部署Node Exporter..."
kubectl apply -f node-exporter.yaml
echo "2. 部署Kube State Metrics..."
kubectl apply -f kube-state-metrics.yaml
echo "3. 更新Prometheus配置..."
kubectl apply -f prometheus-config-updated.yaml
echo "4. 重启Prometheus加载新配置..."
kubectl rollout restart deployment -n monitoring prometheus
echo "等待30秒让监控数据开始收集..."
sleep 30
echo "5. 检查监控目标..."
echo "访问 http://192.168.221.21:30090/targets"
echo "应该看到多个监控目标变为UP状态"
echo ""
echo "6. 测试查询:"
echo "节点状态: up{job=\"node-exporter\"}"
echo "节点CPU: node_cpu_seconds_total"
echo "节点内存: node_memory_MemTotal_bytes"
echo "Pod数量: kube_pod_info"
# 部署Grafana获得漂亮仪表板
vim deploy-grafana-with-dashboards.sh
-------------------------------------==================
#!/bin/bash
echo "=== 部署Grafana和预置仪表板 ==="
# 部署Grafana
cat <<'EOF' | kubectl apply -f -
apiVersion: apps/v1
kind: Deployment
metadata:
name: grafana
namespace: monitoring
spec:
replicas: 1
selector:
matchLabels:
app: grafana
template:
metadata:
labels:
app: grafana
spec:
containers:
- name: grafana
image: grafana/grafana:9.5.2
ports:
- containerPort: 3000
env:
- name: GF_SECURITY_ADMIN_PASSWORD
value: admin
volumeMounts:
- name: grafana-storage
mountPath: /var/lib/grafana
- name: grafana-dashboards
mountPath: /etc/grafana/provisioning/dashboards
- name: grafana-datasources
mountPath: /etc/grafana/provisioning/datasources
volumes:
- name: grafana-storage
emptyDir: {}
- name: grafana-dashboards
configMap:
name: grafana-dashboards
- name: grafana-datasources
configMap:
name: grafana-datasources
---
apiVersion: v1
kind: ConfigMap
metadata:
name: grafana-datasources
namespace: monitoring
data:
prometheus.yaml: |
apiVersion: 1
datasources:
- name: Prometheus
type: prometheus
access: proxy
url: http://prometheus.monitoring.svc.cluster.local:9090
isDefault: true
---
apiVersion: v1
kind: ConfigMap
metadata:
name: grafana-dashboards
namespace: monitoring
data:
node-dashboard.json: |
{
"dashboard": {
"id": null,
"title": "Kubernetes Nodes Dashboard",
"tags": ["kubernetes", "nodes"],
"timezone": "browser",
"panels": [
{
"title": "Node CPU Usage",
"type": "stat",
"targets": [
{
"expr": "100 - (avg by (instance) (rate(node_cpu_seconds_total{mode=\"idle\"}[5m])) * 100)",
"legendFormat": "{{instance}}"
}
],
"format": "percent"
},
{
"title": "Node Memory Usage",
"type": "stat",
"targets": [
{
"expr": "(node_memory_MemTotal_bytes - node_memory_MemFree_bytes - node_memory_Buffers_bytes - node_memory_Cached_bytes) / node_memory_MemTotal_bytes * 100",
"legendFormat": "{{instance}}"
}
],
"format": "percent"
}
]
}
}
---
apiVersion: v1
kind: Service
metadata:
name: grafana
namespace: monitoring
spec:
type: NodePort
selector:
app: grafana
ports:
- port: 3000
targetPort: 3000
nodePort: 30000
EOF
echo "等待Grafana启动..."
sleep 20
echo "Grafana部署完成!"
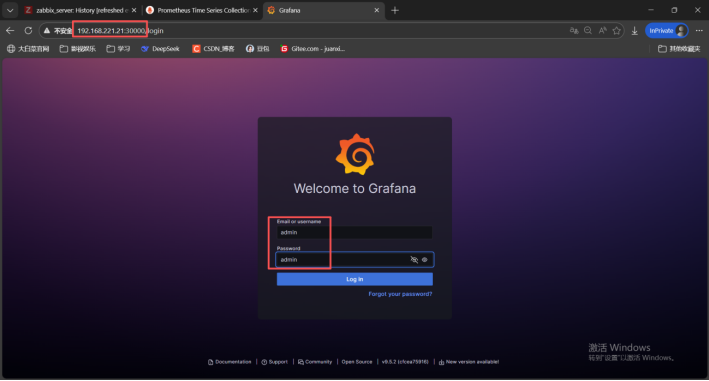
echo "访问地址: http://192.168.221.21:30000"
echo "用户名: admin"
echo "密码: admin"
echo ""
echo "导入预置仪表板:"
echo "1. 登录后点击左侧 '+' 图标"
echo "2. 选择 'Import'"
echo "3. 输入仪表板ID: 3119 (Kubernetes集群监控)"
echo "4. 或 13105 (Node Exporter完整仪表板)"
---------------------------------===========================
# 快速检查脚本
vim check-monitoring-status.sh
------------------------=============================
#!/bin/bash
echo "=== 监控系统状态检查 ==="
echo ""
echo "1. Pod状态:"
kubectl get pods -n monitoring
echo ""
echo "2. 服务状态:"
kubectl get svc -n monitoring
echo ""
echo "3. 监控目标状态 (等待10秒):"
sleep 10
curl -s "http://192.168.221.21:30090/api/v1/targets" | python3 -c "
import json, sys
data = json.load(sys.stdin)
for target in data['data']['activeTargets']:
print(f\"{target['labels']['job']}: {target['health']} - {target['scrapeUrl']}\")
"
echo ""
echo "4. 关键指标检查:"
echo "Node Exporter状态:"
curl -s "http://192.168.221.21:30090/api/v1/query?query=up{job='node-exporter'}" | python3 -m json.tool | grep -A5 '"value"'
echo ""
echo "5. 访问信息:"
echo "Prometheus: http://192.168.221.21:30090"
echo "Grafana: http://192.168.221.21:30000"
-------------------------------=============================
# 运行一键部署
chmod +x deploy-full-monitoring.sh
./deploy-full-monitoring.sh
# 部署Grafana
chmod +x deploy-grafana-with-dashboards.sh
./deploy-grafana-with-dashboards.sh
# 检查状态
chmod +x check-monitoring-status.sh
./check-monitoring-status.sh
实验结果:用192.168.221.21:30000访问Grafana
用192.168.221.21:30090访问Prometheus
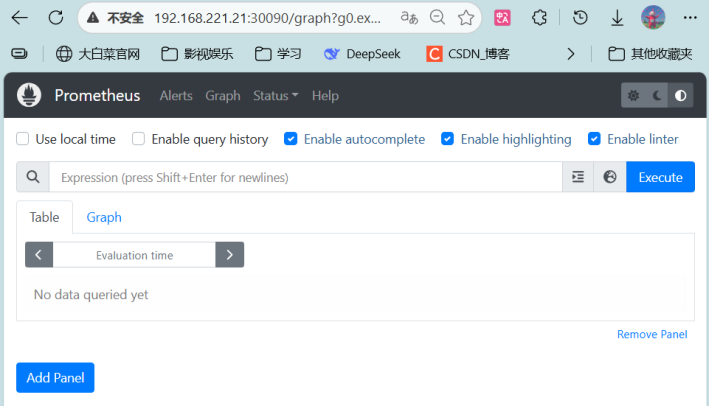
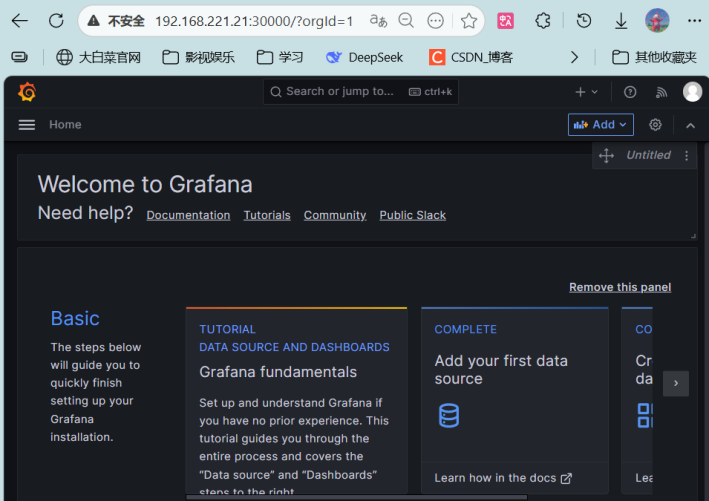
监控页面暂时没有被监控机,后续还有需要改进的,先存一版


 6830
6830

 被折叠的 条评论
为什么被折叠?
被折叠的 条评论
为什么被折叠?
 到【灌水乐园】发言


