 Vue与ECharts结合实现柱状图、折线图和地图绘制


首先,vue使用echarts准备工作
1.安装 npm install echarts@4.9.0 —save-dev || yarn add echarts@4.9.0 —dev
2.成功之后 package.json文件会显示你安装的echarts版本号
3.项目中使用的echarts组件不多的话 就不需要全局引用
单页面引用就可以
import Vue from ‘vue’
import echarts from ‘echarts’
Vue.use(echarts)
全局应用 main.js文件 添加
import echarts from ‘echarts’
Vue.prototype.$echarts = echarts
柱状图
<div ref="libraryStatistics" style="width: 100%; height: 300px"></div>
return {
	options1: {
       legend: { padding: 14 },
       tooltip: {},
       title: {
         subtext: '出库数量' //副标题
       },
       dataset: {
         source: []
       },

       xAxis: { type: 'category' },
       yAxis: {},
       series: []
	 }
},
methods: {
  getToChart() {
      // 请求接口
      storageStatistics('line').then((res) => {
        res.data[0].unshift('warehouse')  //返回数据不符 手动添加最前列 'warehouse'
        this.options1.dataset.source = res.data
        let series = []
        //根据返回数据的长度 添加series 数据(必填 不写不显示)
        for (let i = 0; i < this.options1.dataset.source[0].length - 1; i++) {
          series[i] = { type: 'bar', barWidth: 15 }
        }
        this.options1.series = series
        //this.$refs.libraryStatistics 获取ref盒子
        const libraryStatistics = echarts.init(this.$refs.libraryStatistics)
        //setOption 设置数据
        libraryStatistics.setOption(this.options1)
      })
      //假数据source: [
          //  ['warehouse', '迭代仓库2', '仓库2'],
           // ['2021-06-10', 1, 1],
           // ['2021-06-11', 10, 10],
           // ['2021-06-12', 0, 1000],
           // ['2021-06-13', 0, 0],
           // ['2021-06-14', 0, 0],
           // ['2021-06-15', 11330, 0],
           // ['2021-06-16', 0, 90]
        //]
   }
}
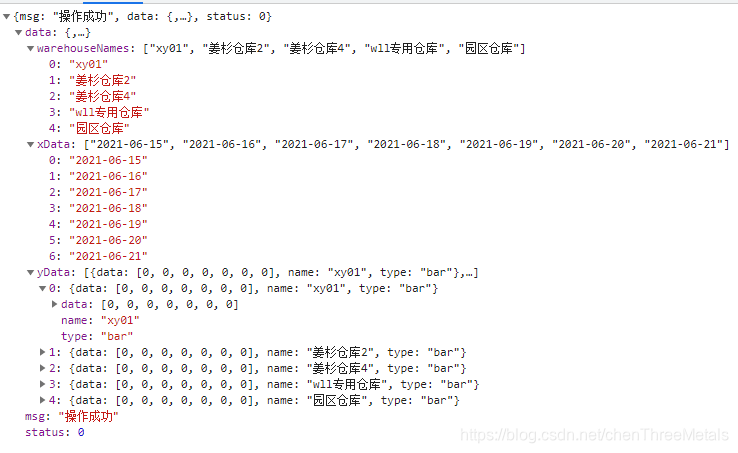
折线图
<div ref="outboundStatisticsSet" style="width: 100%; height: 300px"></div>
return {
option: {
title: {
subtext: '入库数量', //副标题
fontSize: '12px'
},
tooltip: {
trigger: 'axis',
axisPointer: {
type: 'cross',
label: {
backgroundColor: '#6a7985'
}
}
},
// 展示仓库
legend: {
padding: 14,
//展示
data: []
},
grid: {
left: '5%',
right: '5%',
bottom: '13%',
top: '19%',
containLabel: true
},
// 展示日期
xAxis: [
{
type: 'category',
boundaryGap: false,
data: []
}
],
yAxis: [
{
type: 'value'
}
],
//数据
series: []
}
},
methods: {
getToChart() {
// 请求接口
outboundStatistics('bar').then((res) => {
let { warehouseNames, xData, yData } = res.data
this.option.legend.data = warehouseNames
this.option.xAxis[0].data = xData
this.option.series = yData
for (let i = 0; i < this.option.series.length; i++) {
this.option.series[i].areaStyle = {}
this.option.series[i].type = 'line'
this.option.series[i].stack = '总量'
}
const myChart = echarts.init(this.$refs.outboundStatisticsSet)
myChart.setOption(this.option)
})
//
//插件地址:https://echarts.apache.org/examples/zh/editor.html?c=area-stack
}
}
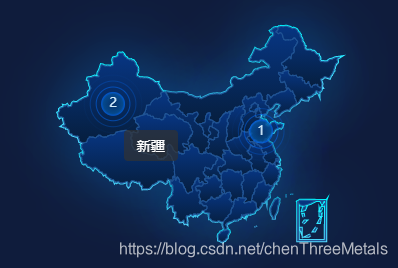
地图
<div ref="echatsMap" style="width: 100%; height: 100%"></div>
//地图需要引用的js文件
import 'echarts/map/js/china.js'
return {
option: {
title: {
subtext: '入库数量', //副标题
fontSize: '12px'
},
tooltip: {
trigger: 'axis',
axisPointer: {
type: 'cross',
label: {
backgroundColor: '#6a7985'
}
}
},
// 展示仓库
legend: {
padding: 14,
//展示
data: []
},
grid: {
left: '5%',
right: '5%',
bottom: '13%',
top: '19%',
containLabel: true
},
// 展示日期
xAxis: [
{
type: 'category',
boundaryGap: false,
data: []
}
],
yAxis: [
{
type: 'value'
}
],
//数据
series: []
}
},
methods: {
// 地图
setMap() {
var echatsMap = echarts.init(this.$refs.echatsMap)
var outname = ['山东', '新疆']
var outvalue = ['1', '2']
var outdata = []
var max = 6000,
min = 10
var maxSize4Pin = 100,
minSize4Pin = 20
for (var i = 0; i < outname.length; i++) {
outdata.push({
name: outname[i],
value: outvalue[i]
})
}
var geoCoordMap = {}
/*获取地图数据*/
var mapFeatures = echarts.getMap('china').geoJson.features
// console.log(mapFeatures)
mapFeatures.forEach(function (v) {
// 地区名称
var name = v.properties.name
// 地区经纬度
geoCoordMap[name] = v.properties.cp
})
var convertData = function (outdata) {
var res = []
for (var i = 0; i < outdata.length; i++) {
var geoCoord = geoCoordMap[outdata[i].name]
if (geoCoord) {
res.push({
name: outdata[i].name,
value: geoCoord.concat(outdata[i].value)
})
}
}
return res
}
let option = {
backgroundColor: '#0F1C3C',
tooltip: {
show: true,
formatter: function (params) {
if (params.name.length > 1) {
return ' ' + params.name + ' '
}
}
},
geo: {
map: 'china',
show: true,
roam: false,
label: {
emphasis: {
show: false
}
},
layoutSize: '100%',
itemStyle: {
normal: {
borderColor: new echarts.graphic.LinearGradient(
0,
0,
0,
1,
[
{
offset: 0,
color: '#00F6FF'
},
{
offset: 1,
color: '#53D9FF'
}
],
false
),
borderWidth: 3,
shadowColor: 'rgba(10,76,139,1)',
shadowOffsetY: 0,
shadowBlur: 60
}
}
},
series: [
{
type: 'map',
map: 'china',
aspectScale: 0.75,
label: {
normal: {
show: false
},
emphasis: {
show: false
}
},
itemStyle: {
normal: {
areaColor: {
x: 0,
y: 0,
x2: 0,
y2: 1,
colorStops: [
{
offset: 0,
color: '#073684' // 0% 处的颜色
},
{
offset: 1,
color: '#061E3D' // 100% 处的颜色
}
]
},
borderColor: '#215495',
borderWidth: 1
},
emphasis: {
areaColor: {
x: 0,
y: 0,
x2: 0,
y2: 1,
colorStops: [
{
offset: 0,
color: '#073684' // 0% 处的颜色
},
{
offset: 1,
color: '#061E3D' // 100% 处的颜色
}
]
}
}
},
data: outdata
},
{
type: 'effectScatter',
coordinateSystem: 'geo',
rippleEffect: {
brushType: 'stroke'
},
showEffectOn: 'render',
itemStyle: {
normal: {
color: {
type: 'radial',
x: 0.5,
y: 0.5,
r: 0.5,
colorStops: [
{
offset: 0,
color: 'rgba(5,80,151,0.2)'
},
{
offset: 0.8,
color: 'rgba(5,80,151,0.8)'
},
{
offset: 1,
color: 'rgba(0,108,255,0.7)'
}
],
global: false // 缺省为 false
}
}
},
label: {
normal: {
show: true,
color: '#fff',
fontWeight: 'bold',
position: 'inside',
formatter: function (para) {
return '{cnNum|' + para.data.value[2] + '}'
},
rich: {
cnNum: {
fontSize: 13,
color: '#D4EEFF'
}
}
}
},
symbol: 'circle',
symbolSize: function (val) {
if (val[2] === 0) {
return 0
}
var a = (maxSize4Pin - minSize4Pin) / (max - min)
var b = maxSize4Pin - a * max
return a * val[2] + b * 1.2
},
data: convertData(outdata),
zlevel: 1
}
]
}
echatsMap.setOption(option)
}
}


 3315
3315

 被折叠的 条评论
为什么被折叠?
被折叠的 条评论
为什么被折叠?
 到【灌水乐园】发言


