option = {
    xAxis: {
        type: 'category',
        data: ['Mon', 'Tue', 'Wed', 'Thu', 'Fri', 'Sat', 'Sun']
    },
    yAxis: {
        show:false,
        type: 'value'
    },
    series: [{
        data: [320, 932, 901, 934, 1290, 1330, 1320],
        type: 'line',
        label: {
							normal: {
								show: true,
								distance: 3,
								fontSize: 11,
								color: "#333",
								formatter: (opt) => { //设置拐点文字颜色
									if (opt.value > 1200) return '{a|' + opt.value + '}';
								},
								rich: {
									a: {
										color: 'red',
									}
								}
							},

						},
        markArea: { //标记区域
							data: [
								[{
									yAxis: '200',
									itemStyle: {
										color: '#fffb87'
									}
								}, {
									yAxis: '400'
								}],
								[{
									yAxis: '400',
									itemStyle: {
										color: '#ffe087'
									}
								}, {
									yAxis: '800'
								}],
								[{
									yAxis: '800',
									itemStyle: {
										color: '#ffe1e1'
									}
								}, {
									yAxis: '1200'
								}],
							]
						},
		markLine: {
          data: [{
            yAxis: '200',lineStyle:{opacity:0},
          },{
            yAxis: '400',lineStyle:{opacity:0},
          },{
            yAxis: '800',lineStyle:{opacity:0},
          },{
            yAxis: '1200',lineStyle:{opacity:0},
          }],
          label:{
              show:true,
              position:"start",
              color:"#000",
          },
        },
    }]
};


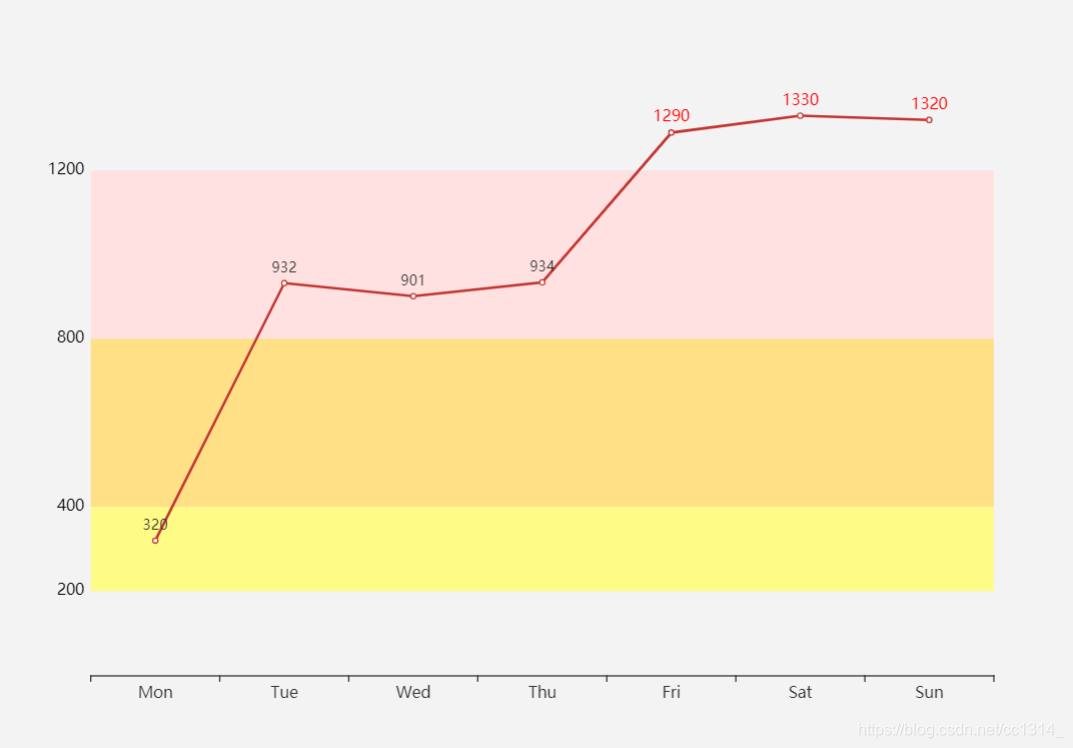
 这篇博客详细介绍了如何使用Echarts库创建一个带有动态线图和不同颜色标记区域的图表。配置包括x轴为日期类型,y轴隐藏,线图数据展示,以及设置拐点文字颜色和样式。同时,通过markArea设置了多个颜色分段,并利用markLine隐藏了辅助线,增强了图表的视觉效果。


 3517
3517

 被折叠的 条评论
为什么被折叠?
被折叠的 条评论
为什么被折叠?
 到【灌水乐园】发言


