 Windows版ELK部署及Java日志展示


windows版 elk部署文档
1、文件准备
官网下载地址: https://www.elastic.co/downloads/past-releases
下载文件:kibana、logstash、elasticsearch,版本号需要一致,示例如下:
https://www.elastic.co/cn/downloads/past-releases/kibana-8-15-1

https://www.elastic.co/cn/downloads/past-releases/logstash-8-15-1

https://www.elastic.co/cn/downloads/past-releases/elasticsearch-8-15-1
注:由于官网版本会导致文件找不到,可点击文件资源1,文件资源2自行下载
2、系统配置启动
以下以8.15.1版本讲解elasticsearch、kibana、logstash 系统的配置与启动
2.1、elasticsarch
2.1.1、生成证书
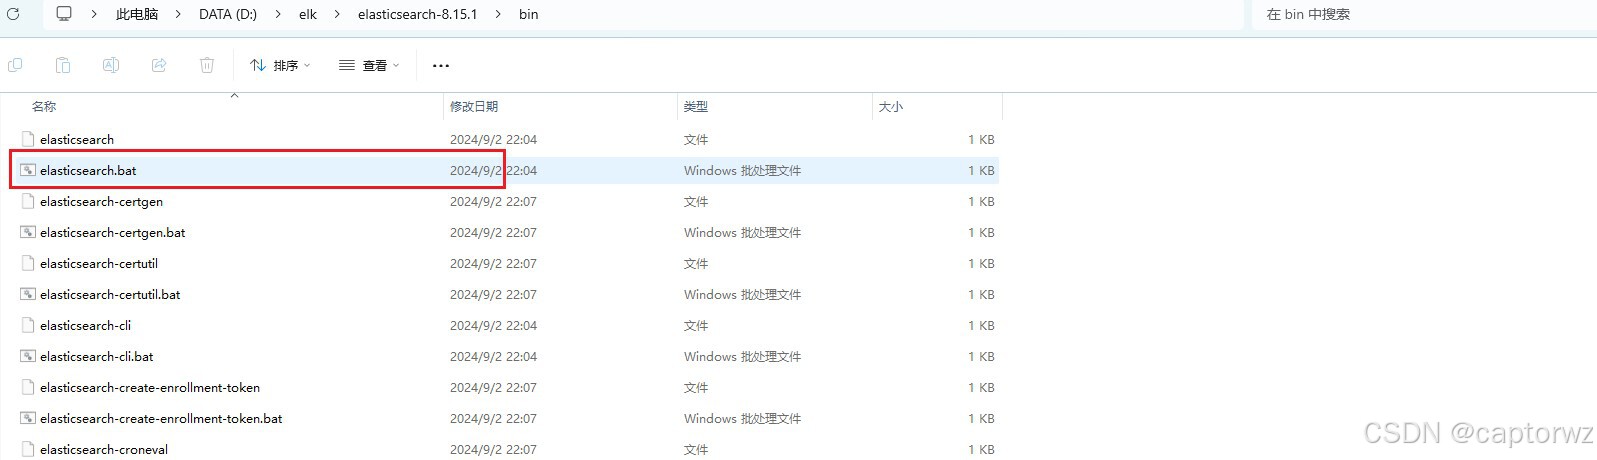
解压压缩包如下图

打开cmd切换到bin目录下,执行
elasticsearch-certutil.bat ca
第一个断点处按下回车键
第二个断点处输入密码,(记录密码,生成秘钥需要用到)
完成后会生成一个文件:elastic-stack-ca.p12

2.1.2、生成秘钥
同理在cmd bin 目录下执行语句
elasticsearch-certutil.bat cert --ca ./elastic-stack-ca.p12
第一个断点处输入密码
第二个断点处直接回车
第三个断点处再次确认密码后回车,后生成一个文件:elastic-certificates.p12
2.1.3、移动凭证
在config文件夹下新建certificates 文件夹,将生成的elastic-stack-ca.p12和elastic-certificates.p12 文件都移动到certificates文件夹内如下图所示

2.1.4、改配置
修改config/elasticsearch.yml ,示例如下(主要修改文件路径)
# ======================== Elasticsearch Configuration =========================
#
# NOTE: Elasticsearch comes with reasonable defaults for most settings.
#       Before you set out to tweak and tune the configuration, make sure you
#       understand what are you trying to accomplish and the consequences.
#
# The primary way of configuring a node is via this file. This template lists
# the most important settings you may want to configure for a production cluster.
#
# Please consult the documentation for further information on configuration options:
# https://www.elastic.co/guide/en/elasticsearch/reference/index.html
#
# ---------------------------------- Cluster -----------------------------------
#
# Use a descriptive name for your cluster:
#
cluster.name: my-elatics
#
# ------------------------------------ Node ------------------------------------
#
# Use a descriptive name for the node:
#
node.name: node-1
#
# Add custom attributes to the node:
#
#node.attr.rack: r1
#
# ----------------------------------- Paths ------------------------------------
#
# Path to directory where to store the data (separate multiple locations by comma):
#
path.data: D:\elk\elasticsearch-8.15.1\data
#
# Path to log files:
#
path.logs: D:\elk\elasticsearch-8.15.1\logs
#
# ----------------------------------- Memory -----------------------------------
#
# Lock the memory on startup:
#
#bootstrap.memory_lock: true
#
# Make sure that the heap size is set to about half the memory available
# on the system and that the owner of the process is allowed to use this
# limit.
#
# Elasticsearch performs poorly when the system is swapping the memory.
#
# ---------------------------------- Network -----------------------------------
#
# By default Elasticsearch is only accessible on localhost. Set a different
# address here to expose this node on the network:
#
network.host: 0.0.0.0
#
# By default Elasticsearch listens for HTTP traffic on the first free port it
# finds starting at 9200. Set a specific HTTP port here:
#
http.port: 9200
#
# For more information, consult the network module documentation.
#
# --------------------------------- Discovery ----------------------------------
#
# Pass an initial list of hosts to perform discovery when this node is started:
# The default list of hosts is ["127.0.0.1", "[::1]"]
#
discovery.seed_hosts: ["127.0.0.1"]
#
# Bootstrap the cluster using an initial set of master-eligible nodes:
#
cluster.initial_master_nodes: ["node-1"]
#
# For more information, consult the discovery and cluster formation module documentation.
#
# ---------------------------------- Various -----------------------------------
#
# Allow wildcard deletion of indices:
#
#action.destructive_requires_name: false

#----------------------- BEGIN SECURITY AUTO CONFIGURATION -----------------------
#
# The following settings, TLS certificates, and keys have been automatically
# generated to configure Elasticsearch security features on 18-09-2024 07:28:42
#
# --------------------------------------------------------------------------------

# Enable security features
xpack.security.enabled: false
# 增加新的参数,head插件可以访问es,跨域访问一定要配置
http.cors.enabled: true
http.cors.allow-origin: "*"

xpack.security.enrollment.enabled: true

# Enable encryption for HTTP API client connections, such as Kibana, Logstash, and Agents
xpack.security.http.ssl:
  enabled: true
  keystore.path: certs/http.p12

# Enable encryption and mutual authentication between cluster nodes
xpack.security.transport.ssl:
  enabled: true
  verification_mode: certificate
  keystore.path: certs/transport.p12
  truststore.path: certs/transport.p12
# Create a new cluster with the current node only
# Additional nodes can still join the cluster later
#cluster.initial_master_nodes: ["DESKTOP-IGN61M2"]

# Allow HTTP API connections from anywhere
# Connections are encrypted and require user authentication
#http.host: 0.0.0.0

# Allow other nodes to join the cluster from anywhere
# Connections are encrypted and mutually authenticated
#transport.host: 0.0.0.0

#----------------------- END SECURITY AUTO CONFIGURATION -------------------------
2.1.5、启动
cmd 在bin目录 下输入elasticsearch ,或点击bin目录下的elasticsearch.bat文件如下图所示
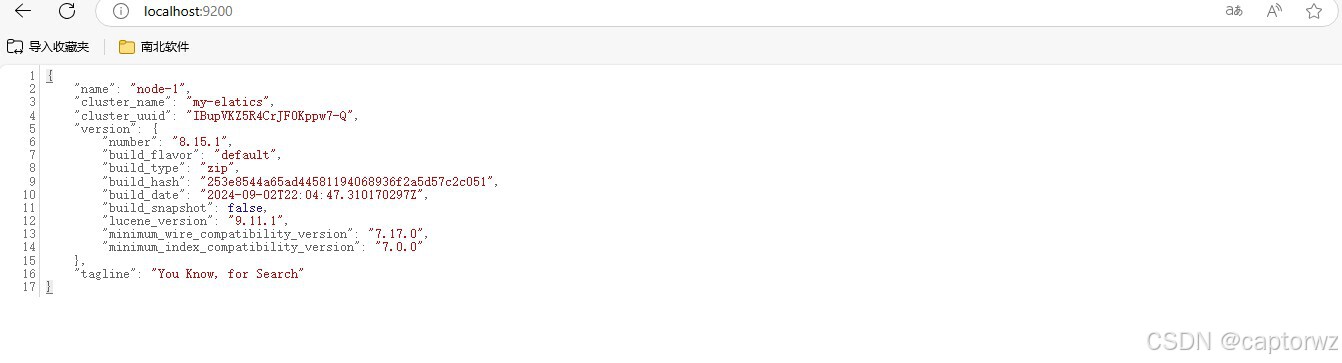
2.1.6、访问运行
访问http://localhost:9200/ 返回以下信息 :
2.1.7、生成kibana账号
账号创建
elastic账号是无法用于kibana的登陆的,所以需要自行创建账号,并授权,cmd定位到es运行时(bin)目录输入以下命令
elasticsearch-users useradd 用户名
接着会提示输入密码,键入密码即可完成用户创建
角色授权操作
elasticsearch-users roles -a superuser 用户名
elasticsearch-users roles -a kibana_system 用户名
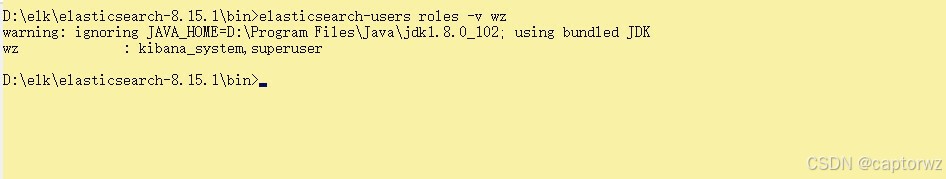
查看授权
elasticsearch-users roles -v 用户名
成功授权结果如下图:
2.2、kibana
2.2.1 改配置
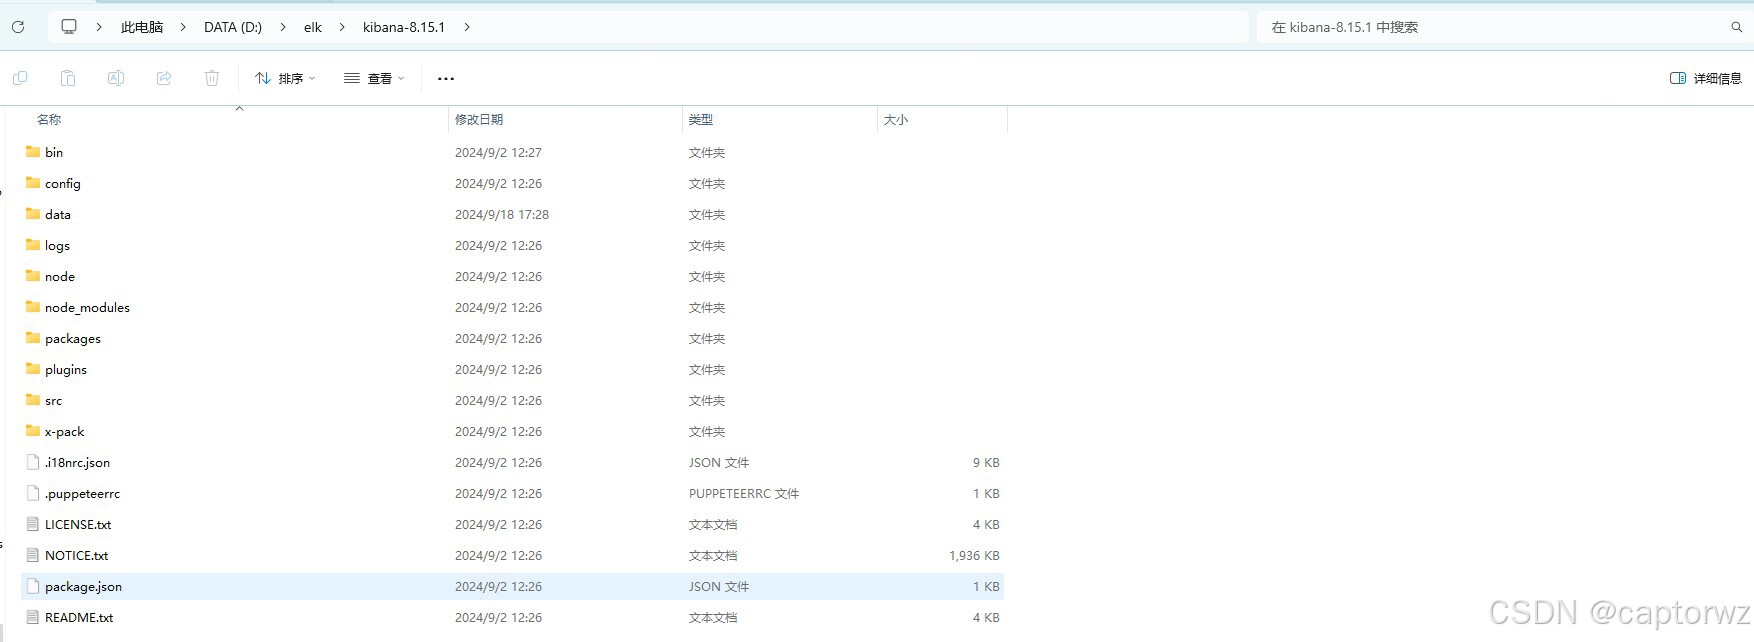
解压压缩文件如图所示
修改config/kibana.yml 示例如下(主要修改elasticsearch 访问路径和用户名密码)
# For more configuration options see the configuration guide for Kibana in
# https://www.elastic.co/guide/index.html

# =================== System: Kibana Server ===================
# Kibana is served by a back end server. This setting specifies the port to use.
server.port: 5601

# Specifies the address to which the Kibana server will bind. IP addresses and host names are both valid values.
# The default is 'localhost', which usually means remote machines will not be able to connect.
# To allow connections from remote users, set this parameter to a non-loopback address.
server.host: "localhost"

# Enables you to specify a path to mount Kibana at if you are running behind a proxy.
# Use the `server.rewriteBasePath` setting to tell Kibana if it should remove the basePath
# from requests it receives, and to prevent a deprecation warning at startup.
# This setting cannot end in a slash.
#server.basePath: ""

# Specifies whether Kibana should rewrite requests that are prefixed with
# `server.basePath` or require that they are rewritten by your reverse proxy.
# Defaults to `false`.
#server.rewriteBasePath: false

# Specifies the public URL at which Kibana is available for end users. If
# `server.basePath` is configured this URL should end with the same basePath.
#server.publicBaseUrl: ""

# The maximum payload size in bytes for incoming server requests.
#server.maxPayload: 1048576

# The Kibana server's name. This is used for display purposes.
#server.name: "your-hostname"

# =================== System: Kibana Server (Optional) ===================
# Enables SSL and paths to the PEM-format SSL certificate and SSL key files, respectively.
# These settings enable SSL for outgoing requests from the Kibana server to the browser.
#server.ssl.enabled: false
#server.ssl.certificate: /path/to/your/server.crt
#server.ssl.key: /path/to/your/server.key

# =================== System: Elasticsearch ===================
# The URLs of the Elasticsearch instances to use for all your queries.
elasticsearch.hosts: ["http://localhost:9200"]

# If your Elasticsearch is protected with basic authentication, these settings provide
# the username and password that the Kibana server uses to perform maintenance on the Kibana
# index at startup. Your Kibana users still need to authenticate with Elasticsearch, which
# is proxied through the Kibana server.
elasticsearch.username: "wz"
elasticsearch.password: "Wz12345678"

# Kibana can also authenticate to Elasticsearch via "service account tokens".
# Service account tokens are Bearer style tokens that replace the traditional username/password based configuration.
# Use this token instead of a username/password.
# elasticsearch.serviceAccountToken: "my_token"

# Time in milliseconds to wait for Elasticsearch to respond to pings. Defaults to the value of
# the elasticsearch.requestTimeout setting.
#elasticsearch.pingTimeout: 1500

# Time in milliseconds to wait for responses from the back end or Elasticsearch. This value
# must be a positive integer.
#elasticsearch.requestTimeout: 30000

# The maximum number of sockets that can be used for communications with elasticsearch.
# Defaults to `Infinity`.
#elasticsearch.maxSockets: 1024

# Specifies whether Kibana should use compression for communications with elasticsearch
# Defaults to `false`.
#elasticsearch.compression: false

# List of Kibana client-side headers to send to Elasticsearch. To send *no* client-side
# headers, set this value to [] (an empty list).
#elasticsearch.requestHeadersWhitelist: [ authorization ]

# Header names and values that are sent to Elasticsearch. Any custom headers cannot be overwritten
# by client-side headers, regardless of the elasticsearch.requestHeadersWhitelist configuration.
#elasticsearch.customHeaders: {}

# Time in milliseconds for Elasticsearch to wait for responses from shards. Set to 0 to disable.
#elasticsearch.shardTimeout: 30000

# =================== System: Elasticsearch (Optional) ===================
# These files are used to verify the identity of Kibana to Elasticsearch and are required when
# xpack.security.http.ssl.client_authentication in Elasticsearch is set to required.
#elasticsearch.ssl.certificate: /path/to/your/client.crt
#elasticsearch.ssl.key: /path/to/your/client.key

# Enables you to specify a path to the PEM file for the certificate
# authority for your Elasticsearch instance.
#elasticsearch.ssl.certificateAuthorities: [ "/path/to/your/CA.pem" ]

# To disregard the validity of SSL certificates, change this setting's value to 'none'.
#elasticsearch.ssl.verificationMode: full

# =================== System: Logging ===================
# Set the value of this setting to off to suppress all logging output, or to debug to log everything. Defaults to 'info'
logging.root.level: info

# Enables you to specify a file where Kibana stores log output.
#logging.appenders.default:
#  type: file
#  fileName: /var/logs/kibana.log
#  layout:
#    type: json

# Example with size based log rotation
#logging.appenders.default:
#  type: rolling-file
#  fileName: /var/logs/kibana.log
#  policy:
#    type: size-limit
#    size: 256mb
#  strategy:
#    type: numeric
#    max: 10
#  layout:
#    type: json

# Logs queries sent to Elasticsearch.
#logging.loggers:
#  - name: elasticsearch.query
#    level: debug

# Logs http responses.
#logging.loggers:
#  - name: http.server.response
#    level: debug

# Logs system usage information.
#logging.loggers:
#  - name: metrics.ops
#    level: debug

# Enables debug logging on the browser (dev console)
#logging.browser.root:
#  level: debug

# =================== System: Other ===================
# The path where Kibana stores persistent data not saved in Elasticsearch. Defaults to data
#path.data: data

# Specifies the path where Kibana creates the process ID file.
#pid.file: /run/kibana/kibana.pid

# Set the interval in milliseconds to sample system and process performance
# metrics. Minimum is 100ms. Defaults to 5000ms.
#ops.interval: 5000

# Specifies locale to be used for all localizable strings, dates and number formats.
# Supported languages are the following: English (default) "en", Chinese "zh-CN", Japanese "ja-JP", French "fr-FR".
i18n.locale: "zh-CN"

# =================== Frequently used (Optional)===================

# =================== Saved Objects: Migrations ===================
# Saved object migrations run at startup. If you run into migration-related issues, you might need to adjust these settings.

# The number of documents migrated at a time.
# If Kibana can't start up or upgrade due to an Elasticsearch `circuit_breaking_exception`,
# use a smaller batchSize value to reduce the memory pressure. Defaults to 1000 objects per batch.
#migrations.batchSize: 1000

# The maximum payload size for indexing batches of upgraded saved objects.
# To avoid migrations failing due to a 413 Request Entity Too Large response from Elasticsearch.
# This value should be lower than or equal to your Elasticsearch cluster’s `http.max_content_length`
# configuration option. Default: 100mb
#migrations.maxBatchSizeBytes: 100mb

# The number of times to retry temporary migration failures. Increase the setting
# if migrations fail frequently with a message such as `Unable to complete the [...] step after
# 15 attempts, terminating`. Defaults to 15
#migrations.retryAttempts: 15

# =================== Search Autocomplete ===================
# Time in milliseconds to wait for autocomplete suggestions from Elasticsearch.
# This value must be a whole number greater than zero. Defaults to 1000ms
#unifiedSearch.autocomplete.valueSuggestions.timeout: 1000

# Maximum number of documents loaded by each shard to generate autocomplete suggestions.
# This value must be a whole number greater than zero. Defaults to 100_000
#unifiedSearch.autocomplete.valueSuggestions.terminateAfter: 100000
2.2.2 启动
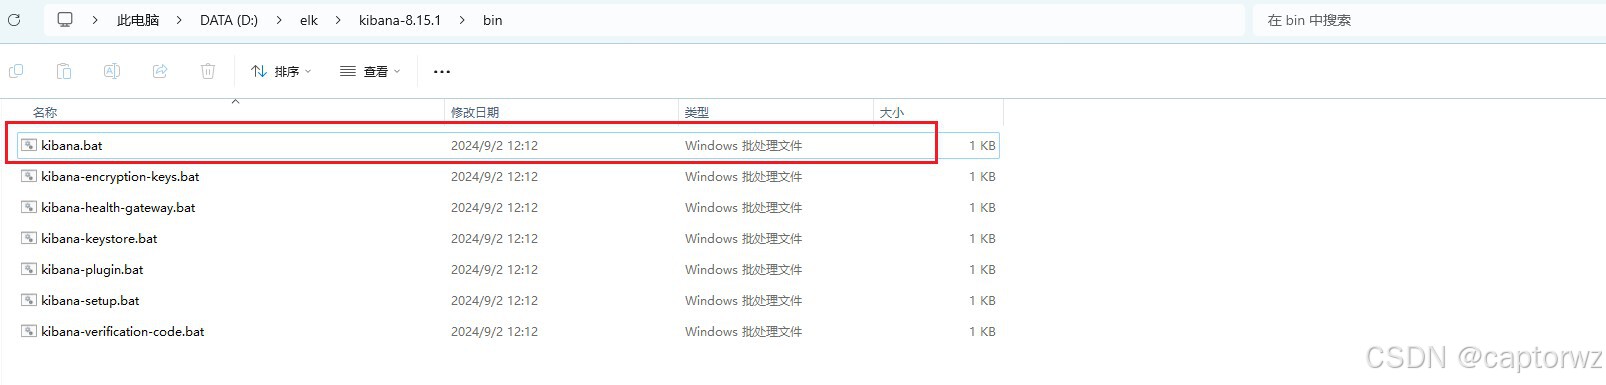
cmd 在bin目录 下输入kibana,或点击bin目录下的kibana.bat文件如下图所示
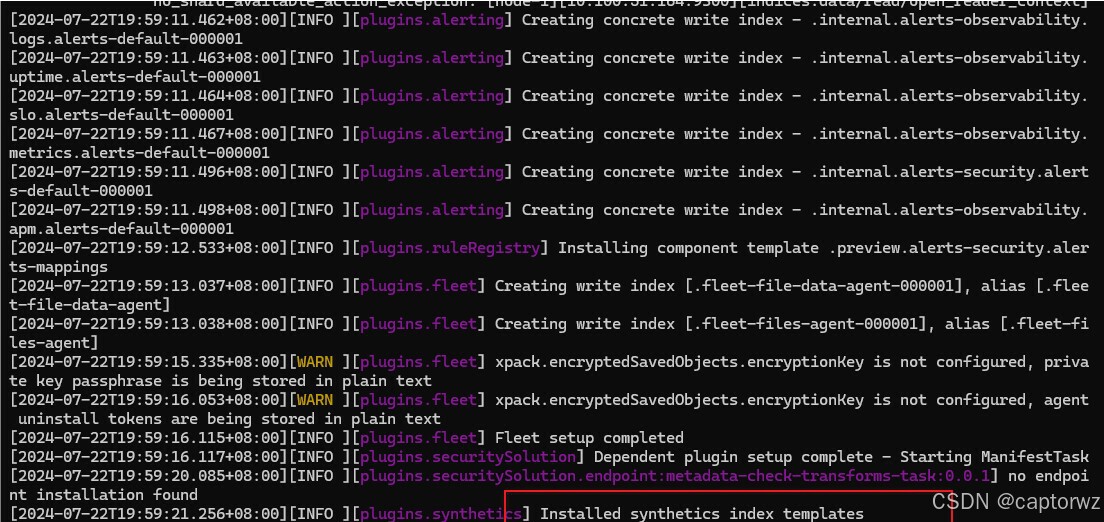
启动成功如下图:
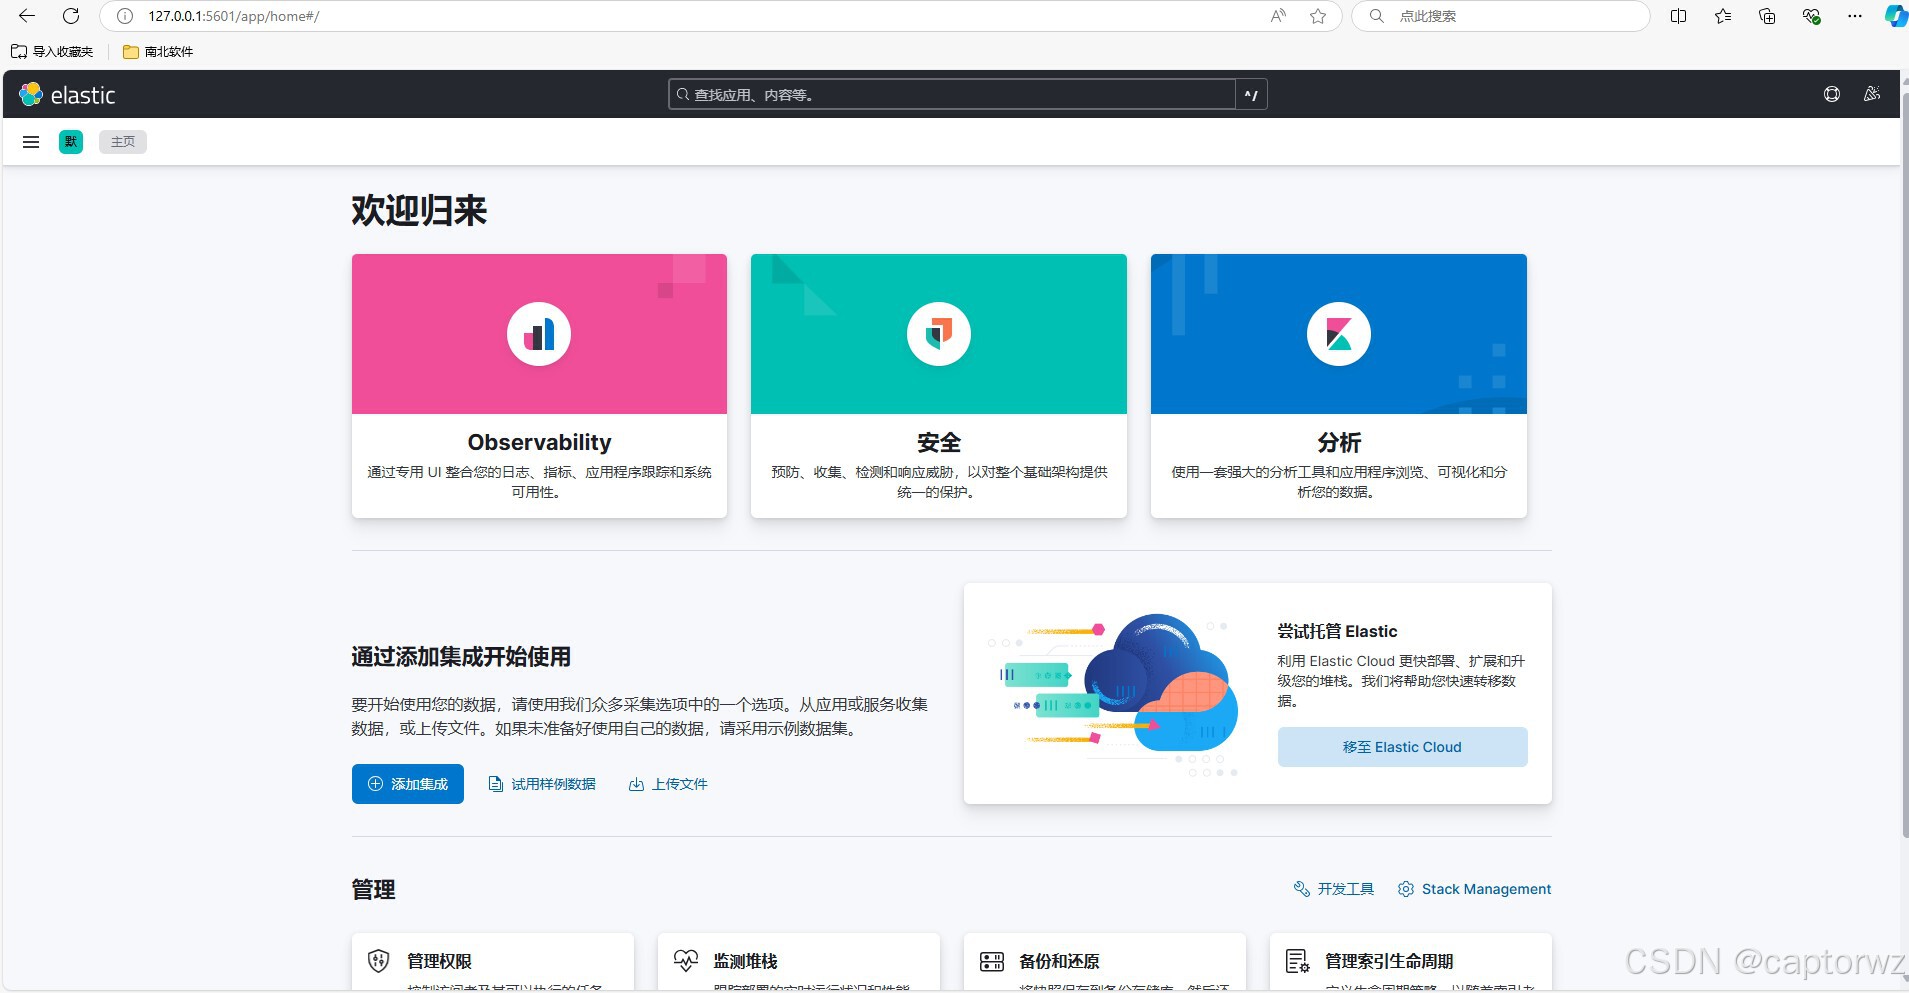
2.2.3 访问测试
访问http://localhost:5601,登录账号和密码(可能免密登录)
成功访问后如下图所示
2.3 logstash
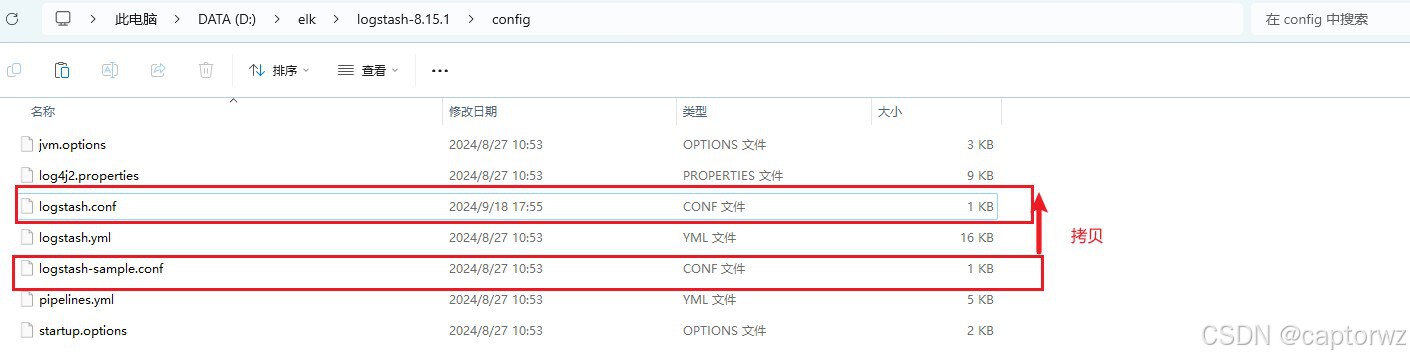
2.3.1 改配置
修改config/logstash-sample文件,也可复制一份修改为 logstash.conf文件
input { stdin { } }


input {
  tcp {
	#不配置默认是安装服务器ip
    #host => "localhost"
	#开启的端口
    port => 5044
    mode => "server"
    tags => ["tags"]
	#输出json格式,需要装插件
    codec => json_lines
  }

}


output {
 stdout{codec =>rubydebug}
  elasticsearch {
   #es地址,可多个
   hosts => ["localhost:9200"]
    action => "index"
	#获取输出参数"indexname"值当做索引,如果没有则会自动创建对应索引(需要es开启自动创建索引)
    index => "%{indexname}"
   }
}

#input {
#  beats {
#    port => 5044
#  }
#}
#
#output {
#  file {
#    path => "D:\elk\logstash-8.15.1\logstash-test.log"                        #在web1节点本地生成一份日志文件
#  }
#  elasticsearch {
#    hosts => ["http://localhost:9200"]
#    index => "%{[@metadata][beat]}-%{[@metadata][version]}-%{+YYYY.MM.dd}"
#
#	#user => "elatics"
#    #password => "Wz12345678"
#  }
#}
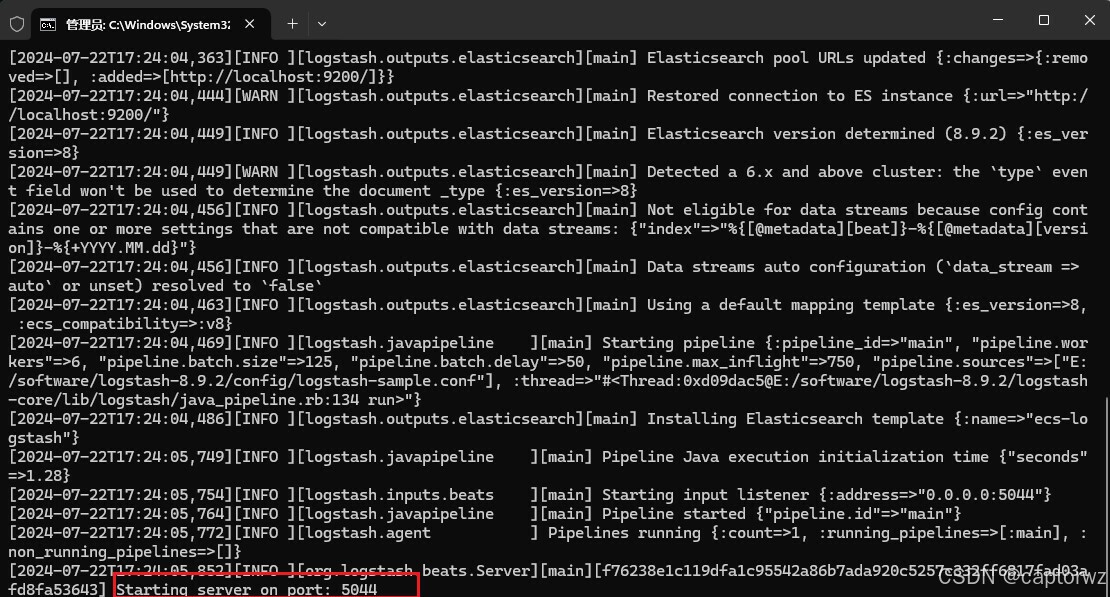
2.3.2 启动
在bin目录下执行
logstash.bat -f ./config/logstash.conf
2.4 启动脚本
可自定义bat脚本一键启动各系统cmd,示例如下
@echo off
echo 启动elasticsearch...
start /d "D:\elk\elasticsearch-8.15.1\bin" elasticsearch

echo 启动kibana...
start /d "D:\elk\kibana-8.15.1\bin" kibana

echo 启动logstash...
start /d "D:\elk\logstash-8.15.1\bin" logstash.bat -f ./config/logstash.conf
3、java maven 项目日志在kibana中展示
3.1 引入pom依赖
引入logstash相关依赖,默认已配置 logback-config.xml相关文件和依赖
<dependencies>
   <dependency>
      <groupId>net.logstash.logback</groupId>
      <artifactId>logstash-logback-encoder</artifactId>
      <version>5.3</version>
   </dependency>
</dependencies>
3.2 在logback-config.xml 中添加配置
   <!-- logback 和 logstash 通讯配置 -->
   <appender name="SOCKET" class="net.logstash.logback.appender.LogstashSocketAppender">
      <filter class="ch.qos.logback.classic.filter.ThresholdFilter">
         <level>ERROR</level>
      </filter>
      <host>127.0.0.1</host>
      <port>5044</port>
   </appender>
  <!-- logstash远程日志配置-->
	<appender name="LOGSTASH" class="net.logstash.logback.appender.LogstashTcpSocketAppender">
		<filter class="ch.qos.logback.classic.filter.ThresholdFilter">
			<level>ERROR</level>
		</filter>
		<destination>127.0.0.1:5044</destination>
		<!--输出打印json格式-->
		<encoder charset="UTF-8" class="net.logstash.logback.encoder.LoggingEventCompositeJsonEncoder">
			<providers>
				<pattern>
					<pattern>
						<!--输出日志可自定义,可根据自己需要配置-->
						{
						<!--es索引名称 -->
						"indexname":"test_logstash3",
						<!--应用名称 -->
<!--						"appname":"${spring.application.name}",-->
						<!--服务器ip -->
<!--						"host": "%ip",-->
						<!--应用端口 -->
<!--						"port": "${spring.application.index}",-->
						<!--打印时间 -->
						"timestamp": "%d{yyyy-MM-dd HH:mm:ss.SSS}",
						<!--线程名称 -->
						"thread": "%thread",
						<!--日志级别 -->
						"level": "%level",
						<!--日志名称 -->
						"logger_name": "%logger",
						<!--日志信息 -->
						"message": "%msg",
						<!--日志堆栈 -->
						"stack_trace": "%exception"
						}
					</pattern>
				</pattern>
			</providers>
		</encoder>
	</appender>
	<root >
		<level value="ERROR" />
		<appender-ref ref="SOCKET"/>
		<appender-ref ref="LOGSTASH"/>
	</root>
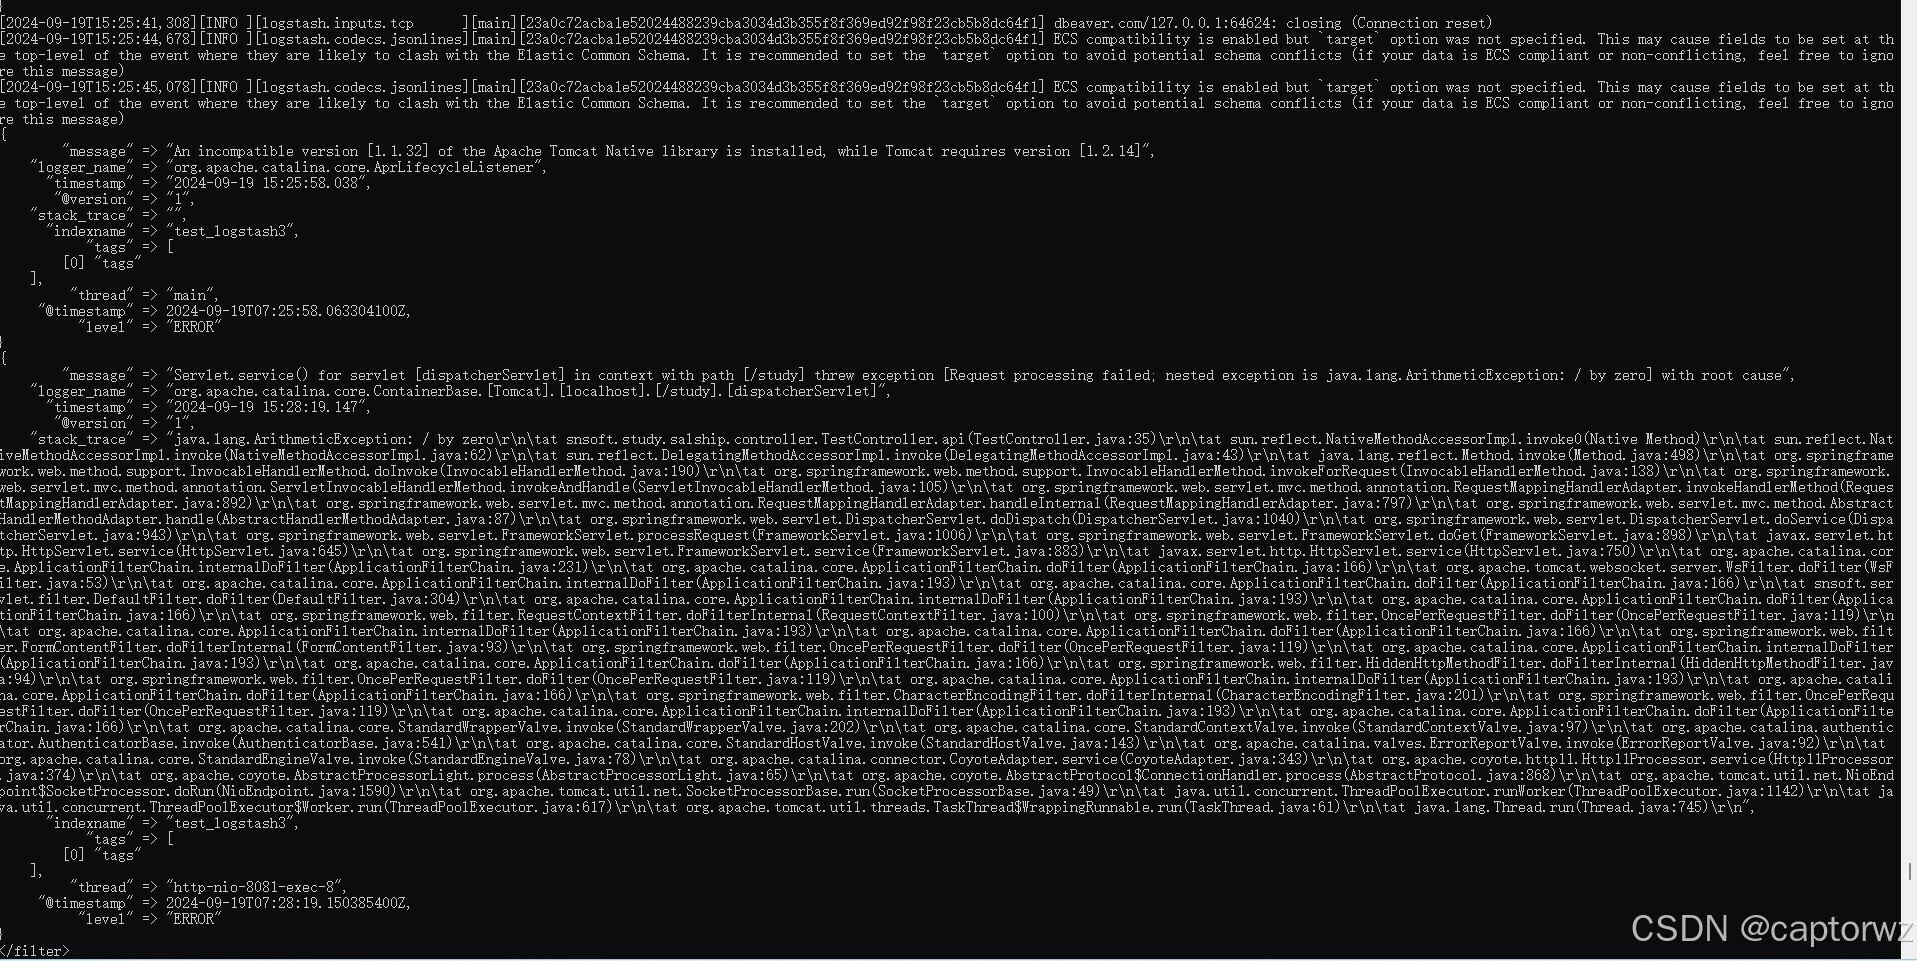
3.3 logstash查看日志
如3.2所示,建立了一个索引 index=test_logstash3 并且日志级别 level = ERROR 的远程日志配置
在logstash传输的日志如下图
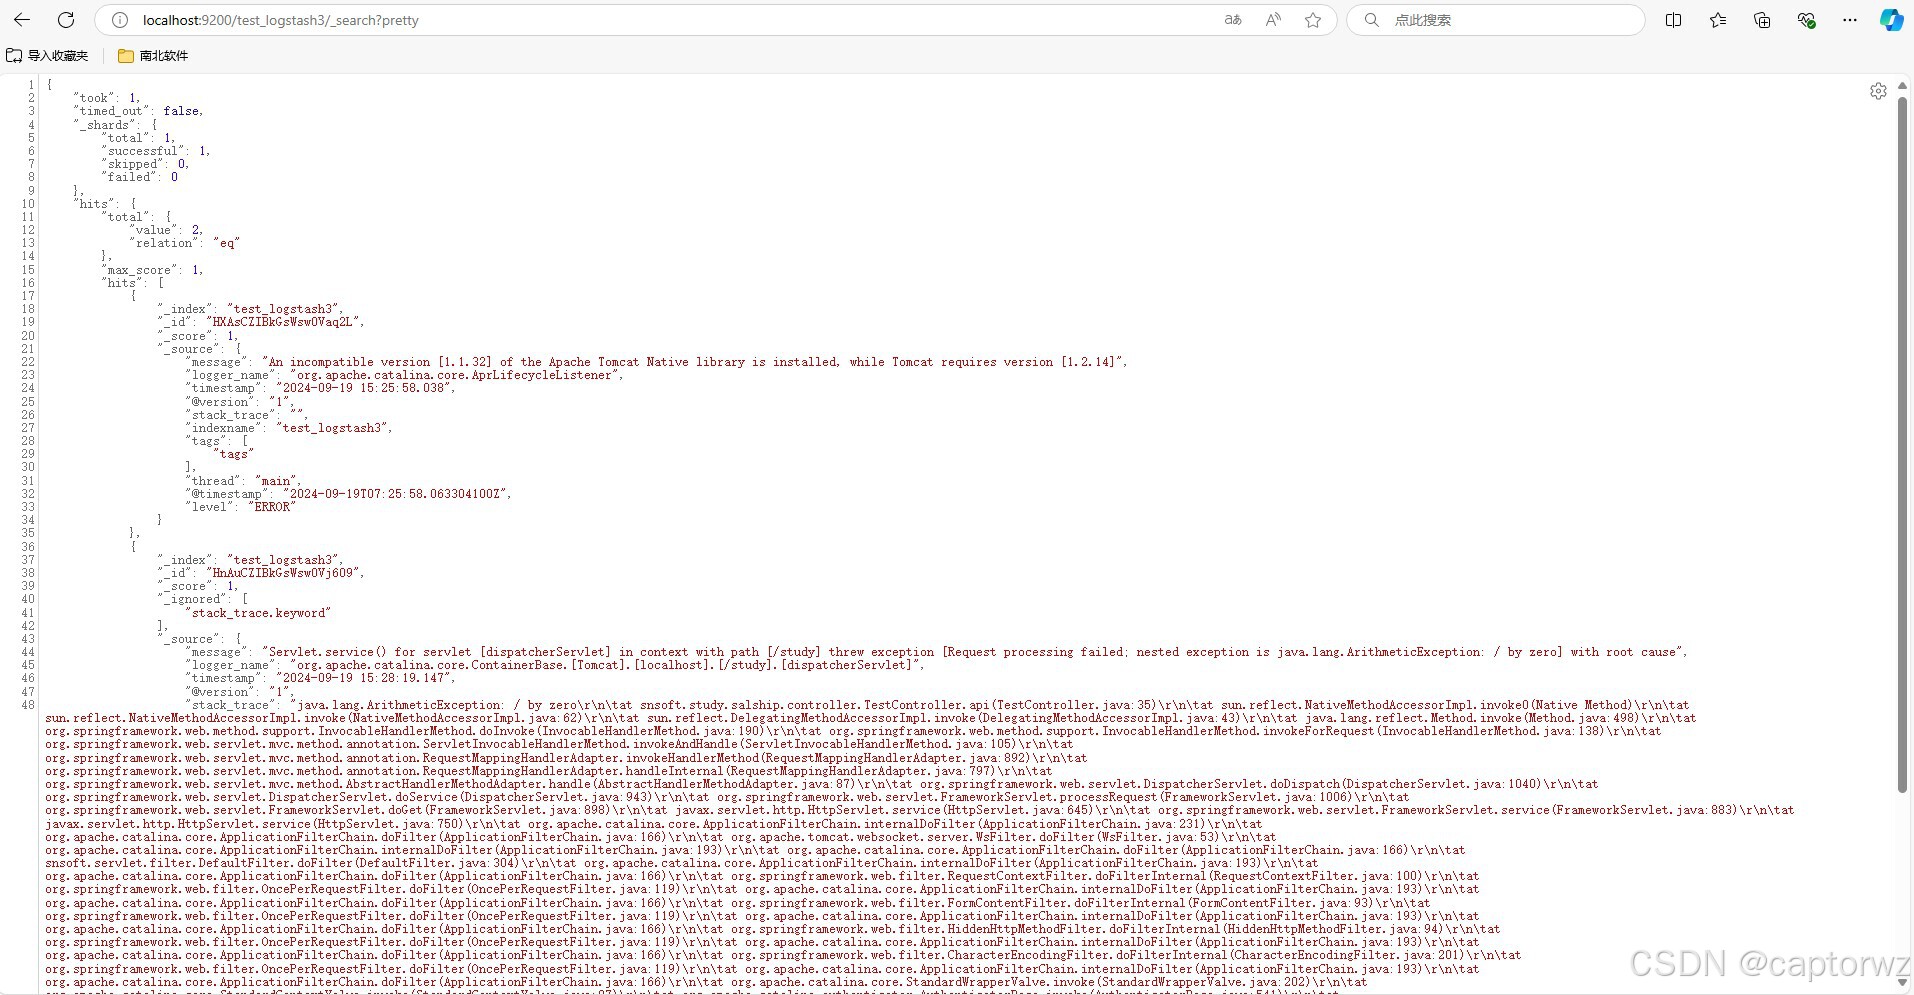
3.4 elasticsearch中查看日志
如图所示查看 localhost:9200/test_logstash3/_search?pretty
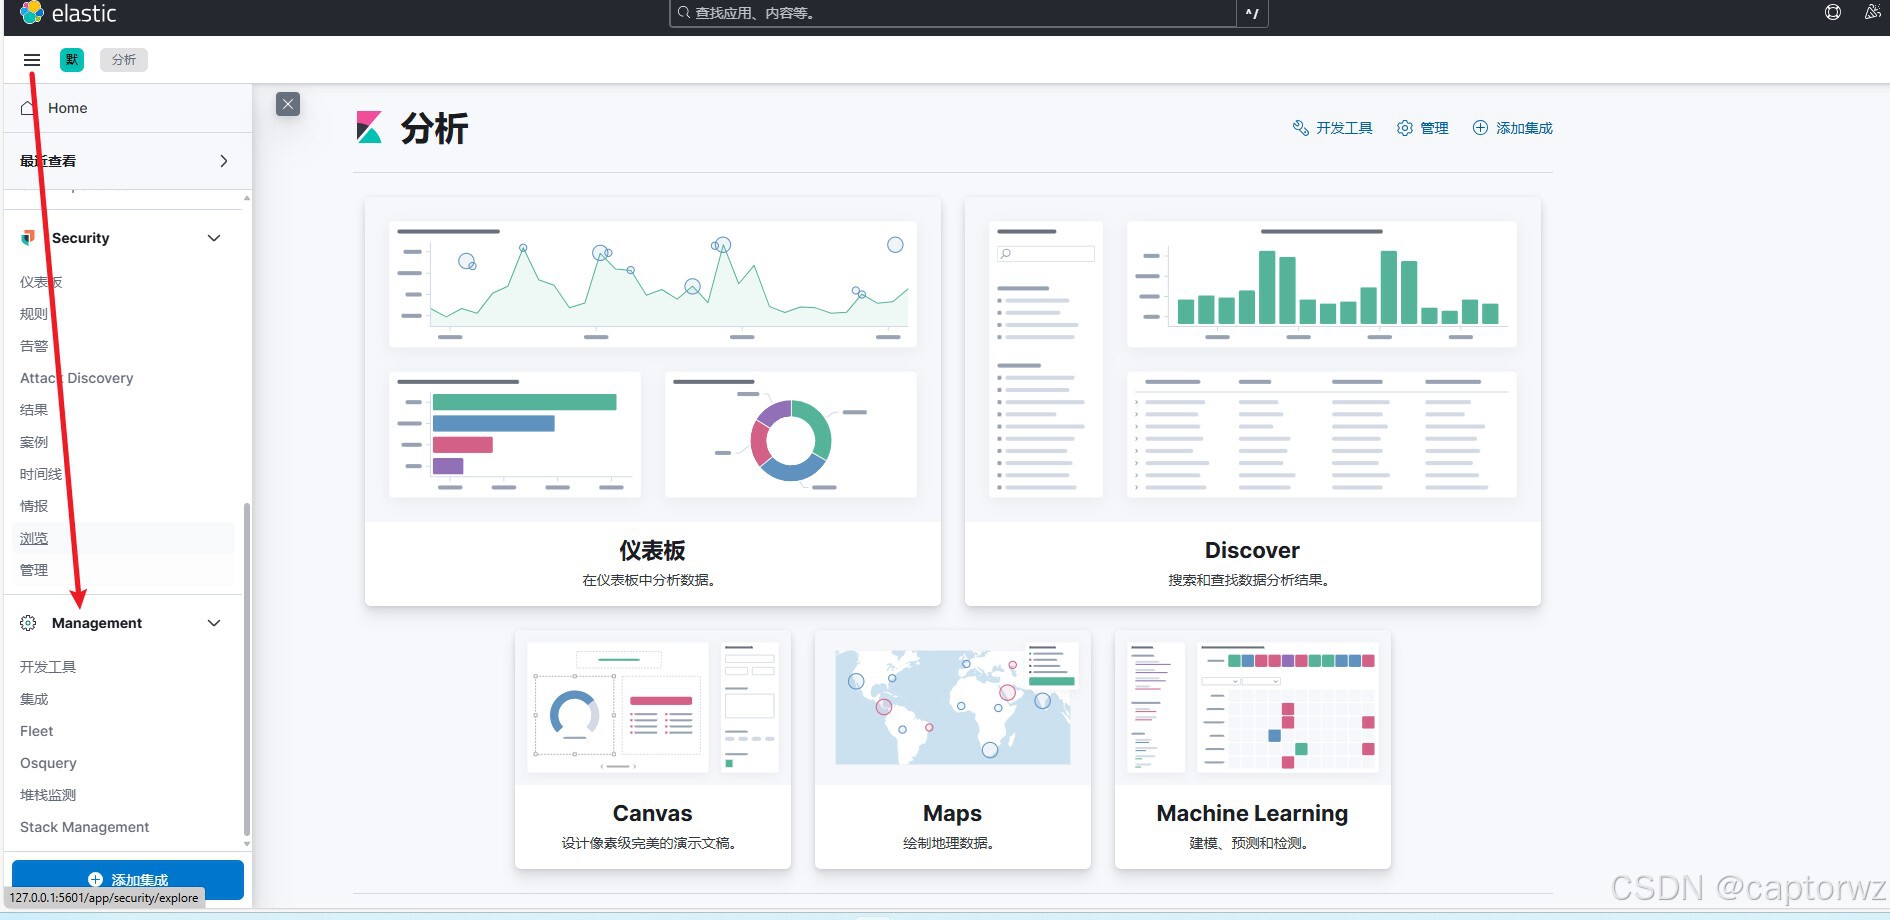
3.5 kibana 创建索引和数据视图查询日志
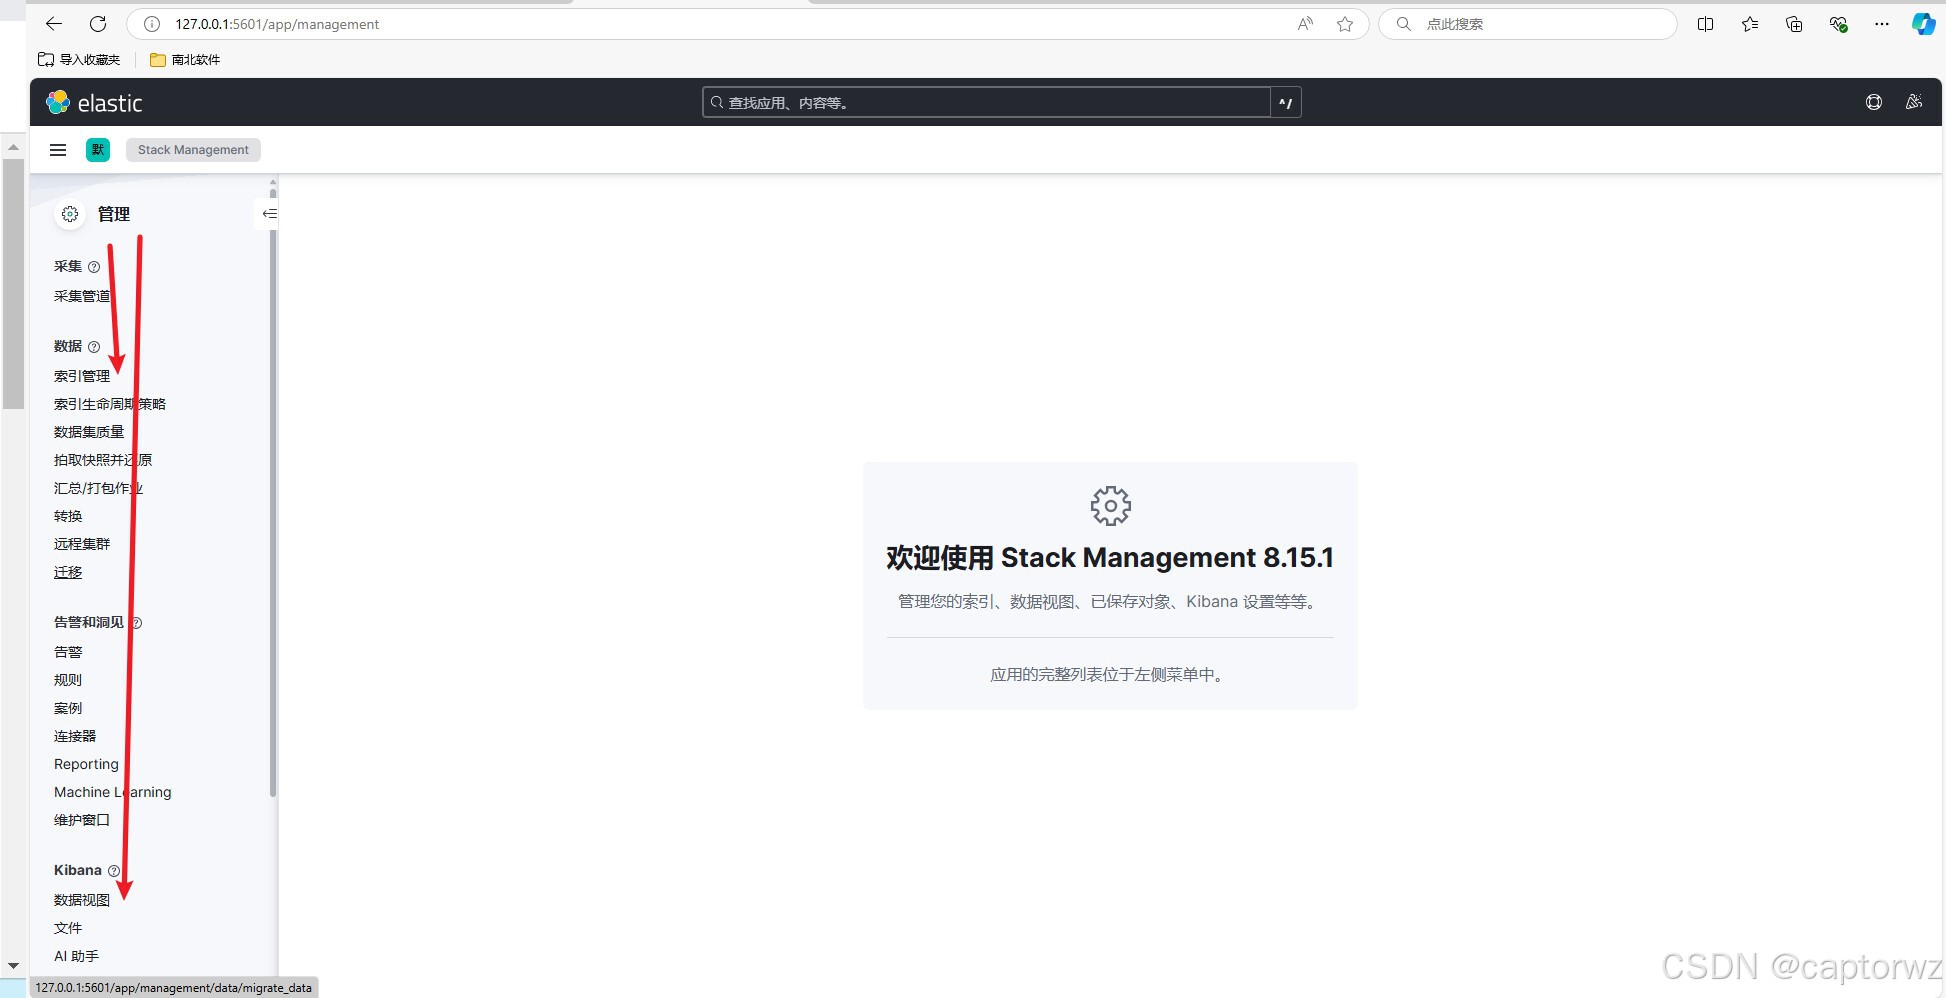
如下图所示,在首页点击菜单栏,并点击management 进入管理界面
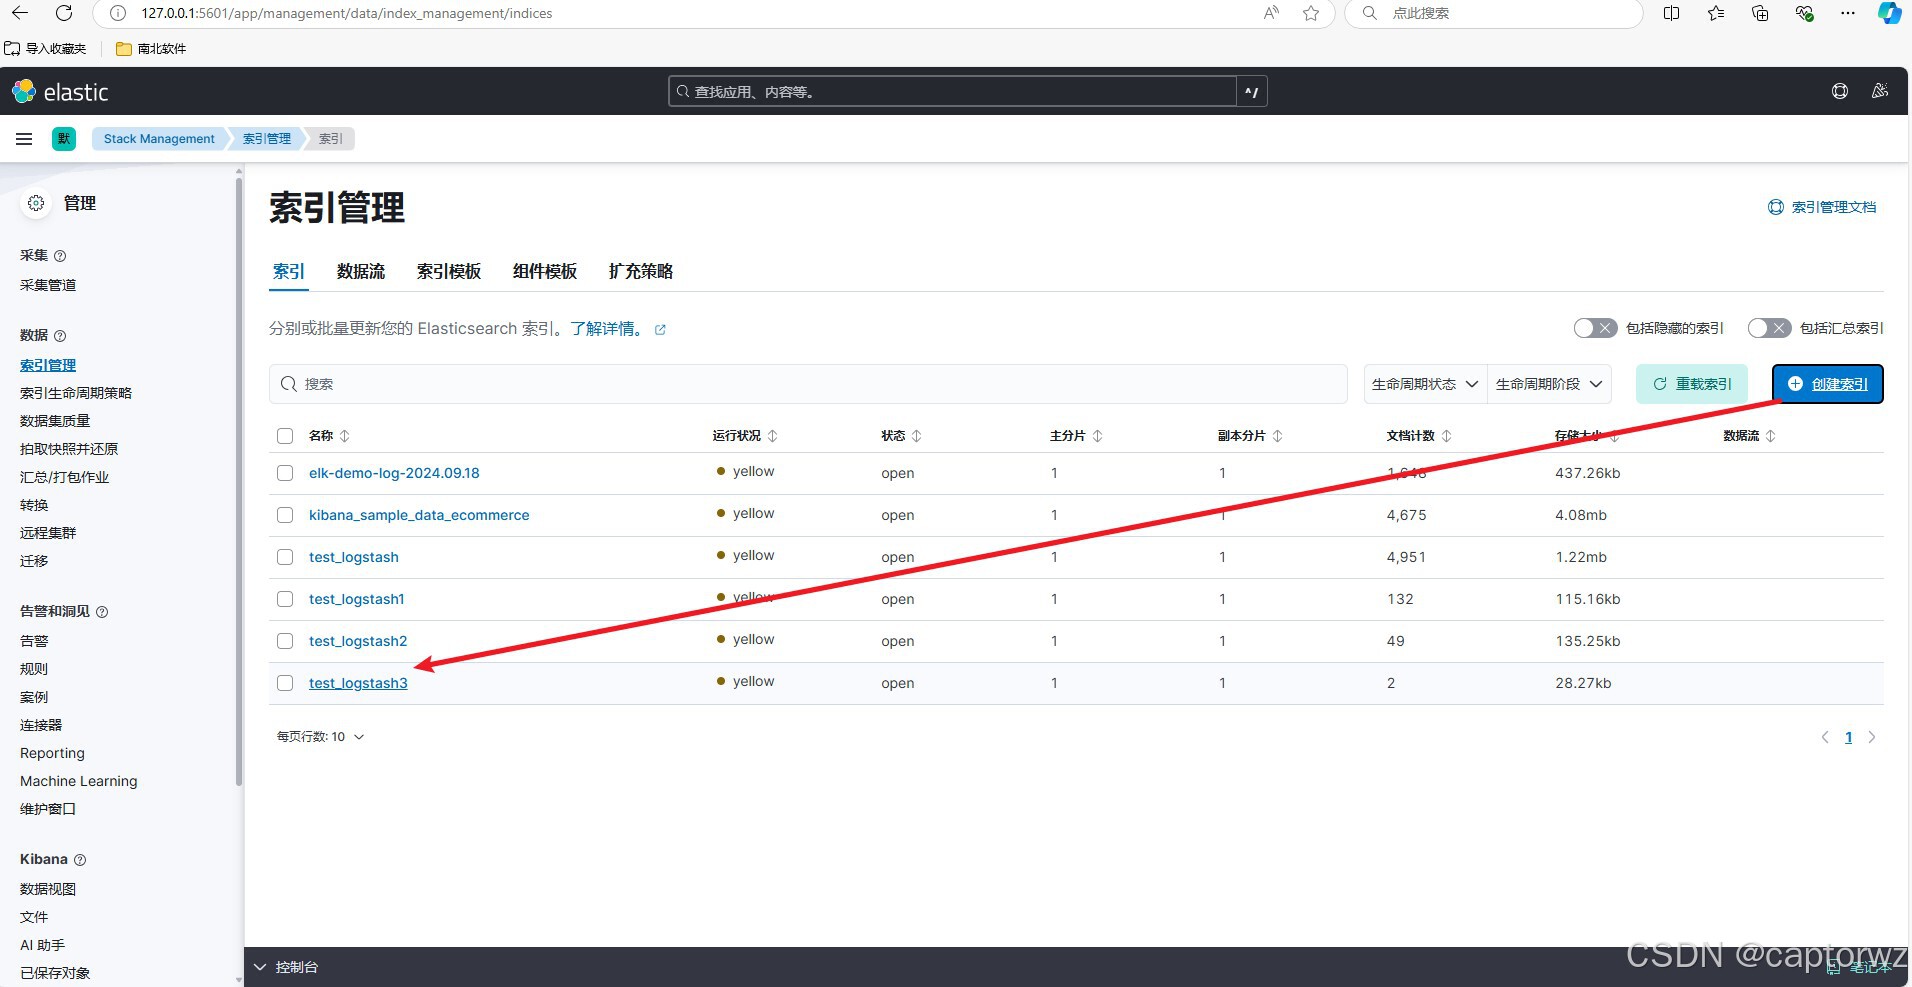
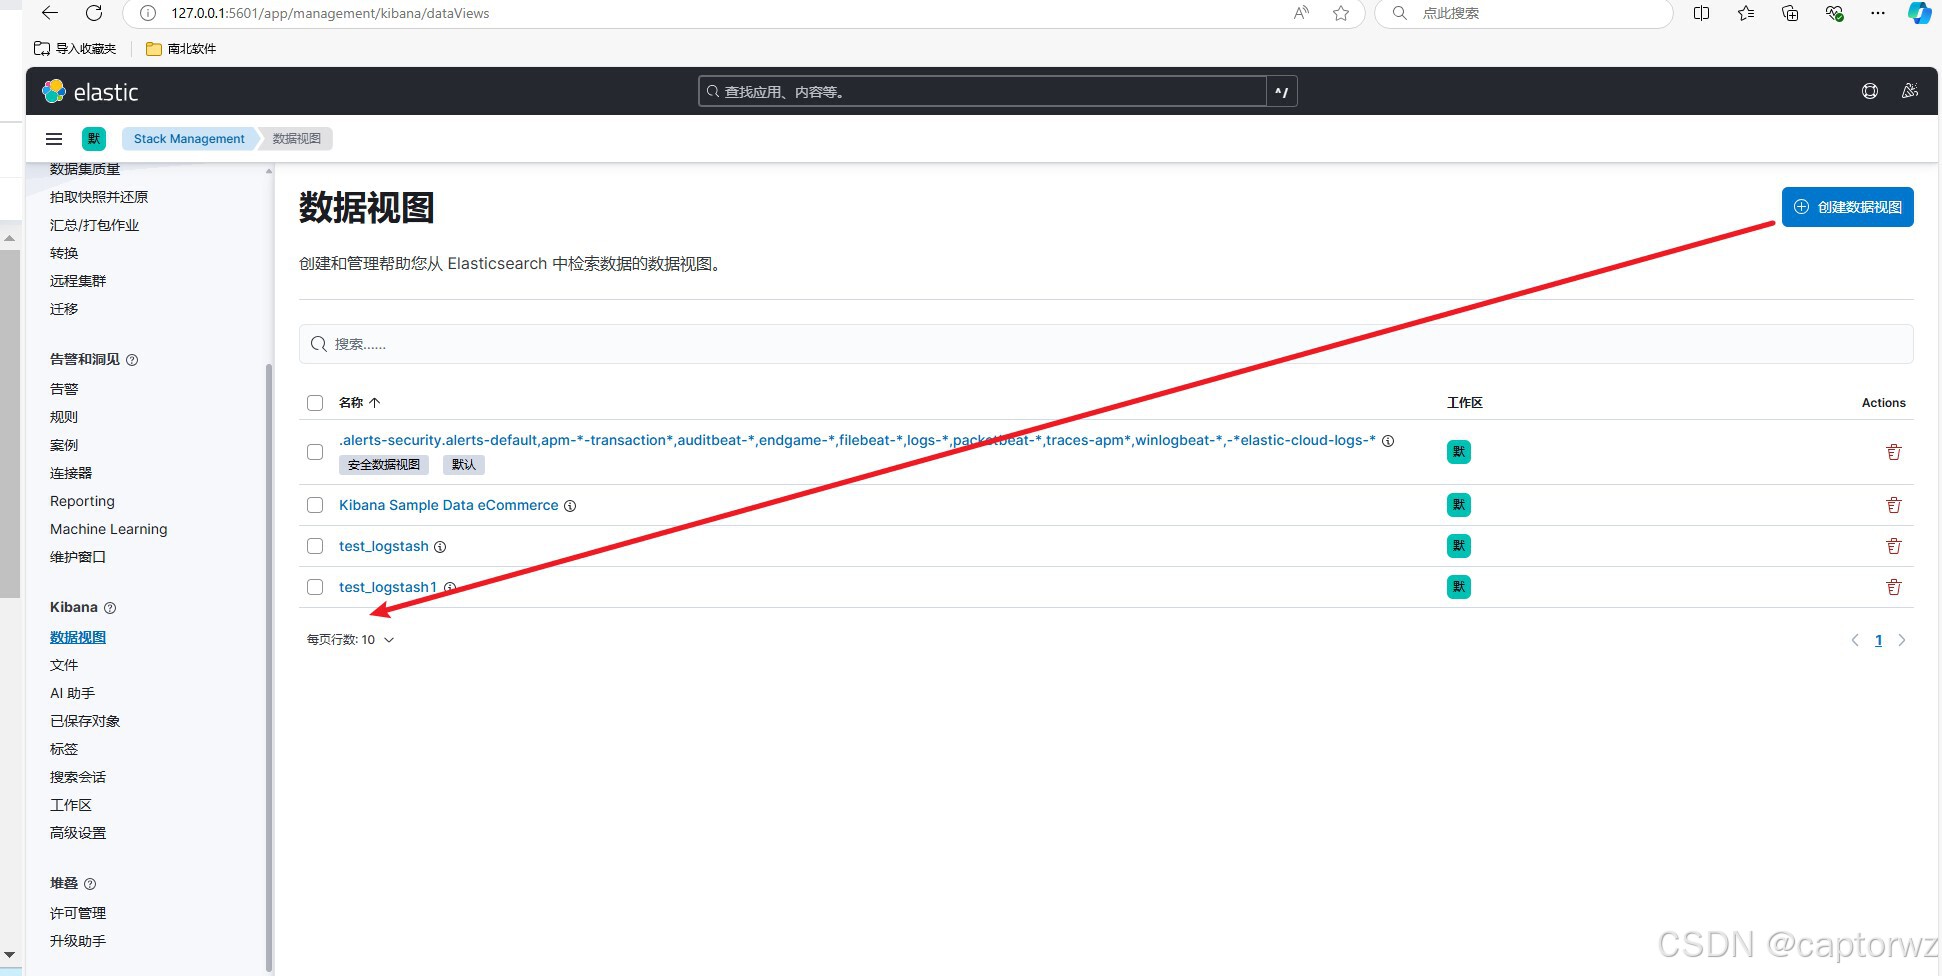
分别点击索引管理和视图管理页面创建索引和视图
在索引管理下默认会创建logstash传输的日志所处索引,如果没有则创建索引如下图
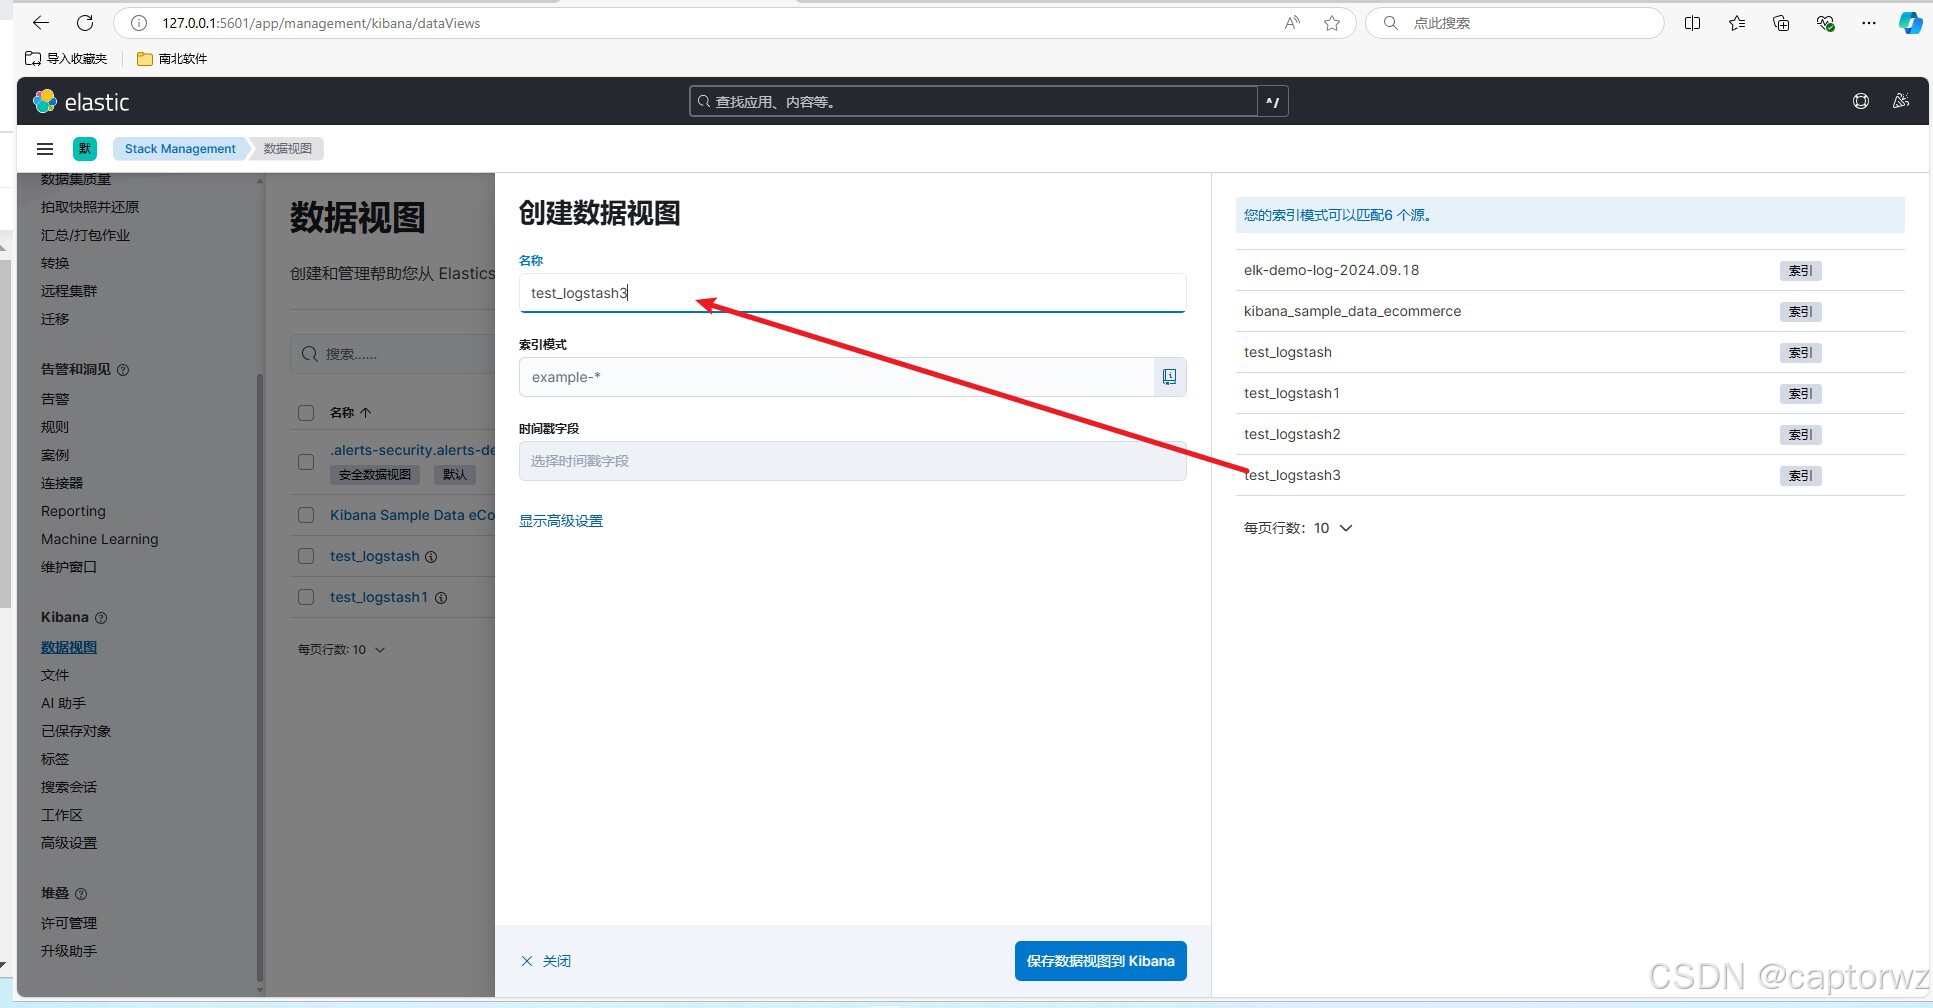
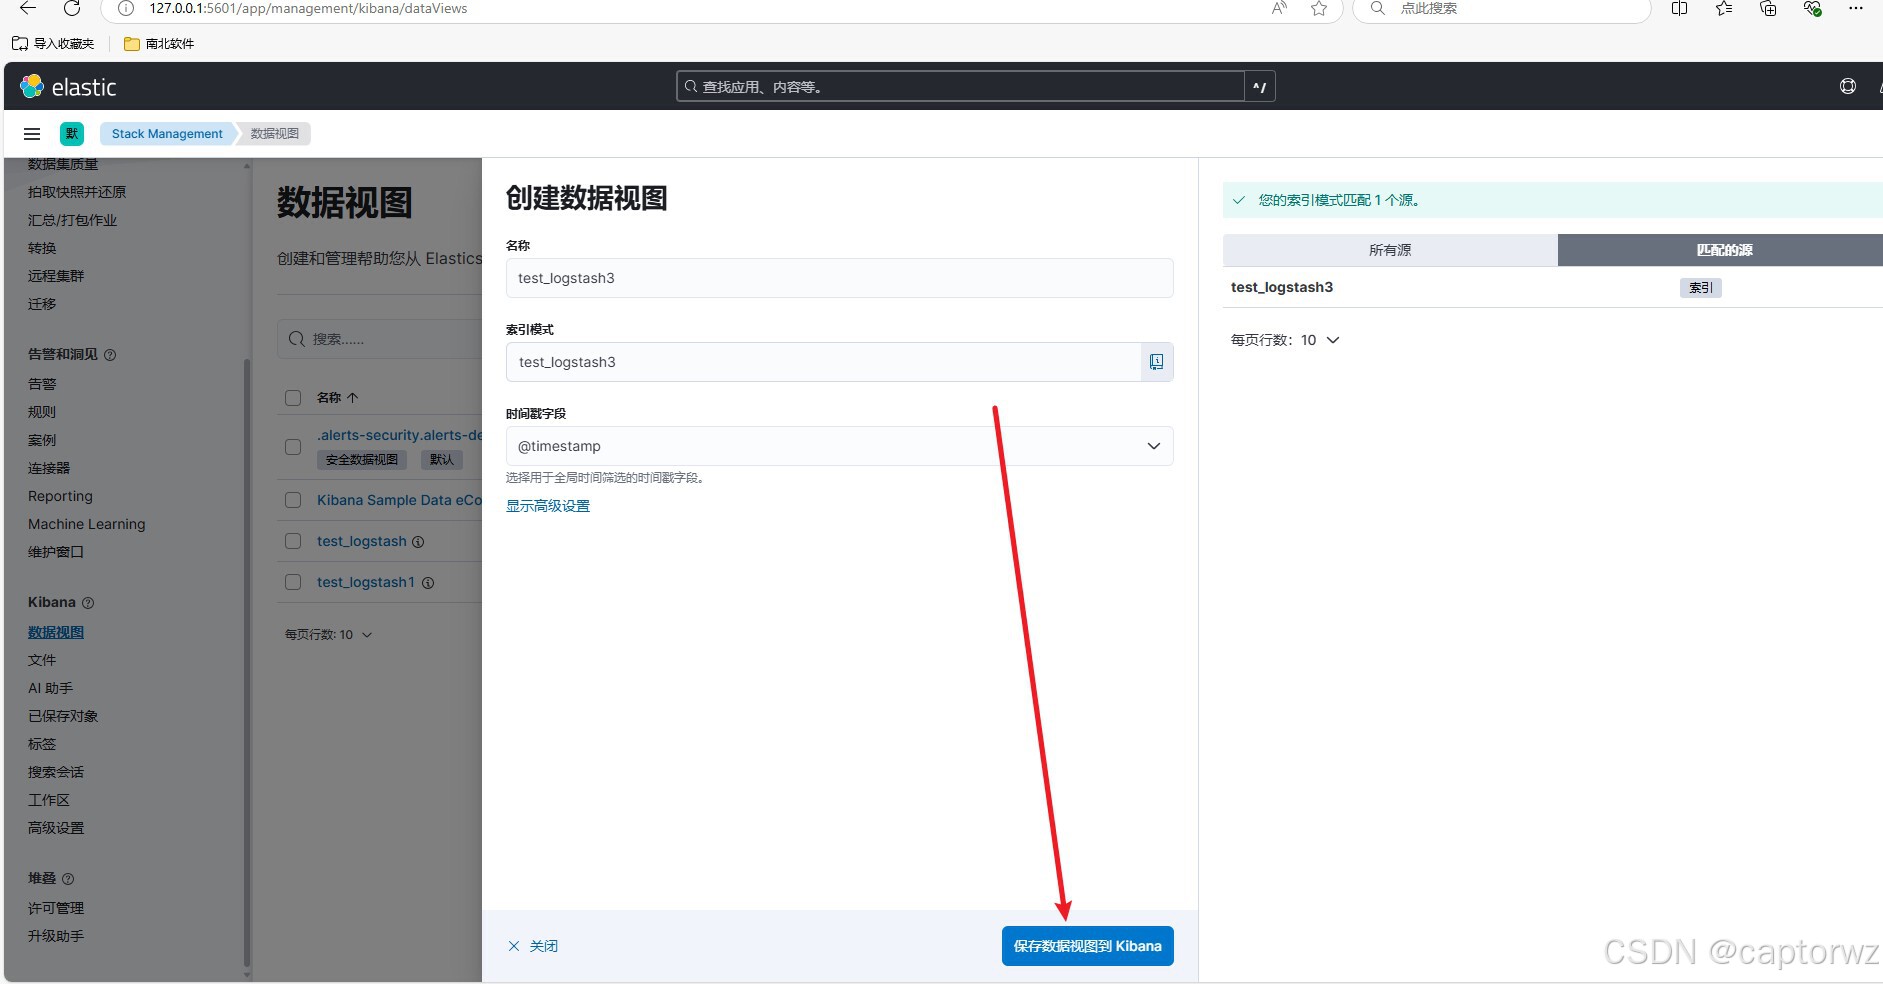
创建数据视图如下图
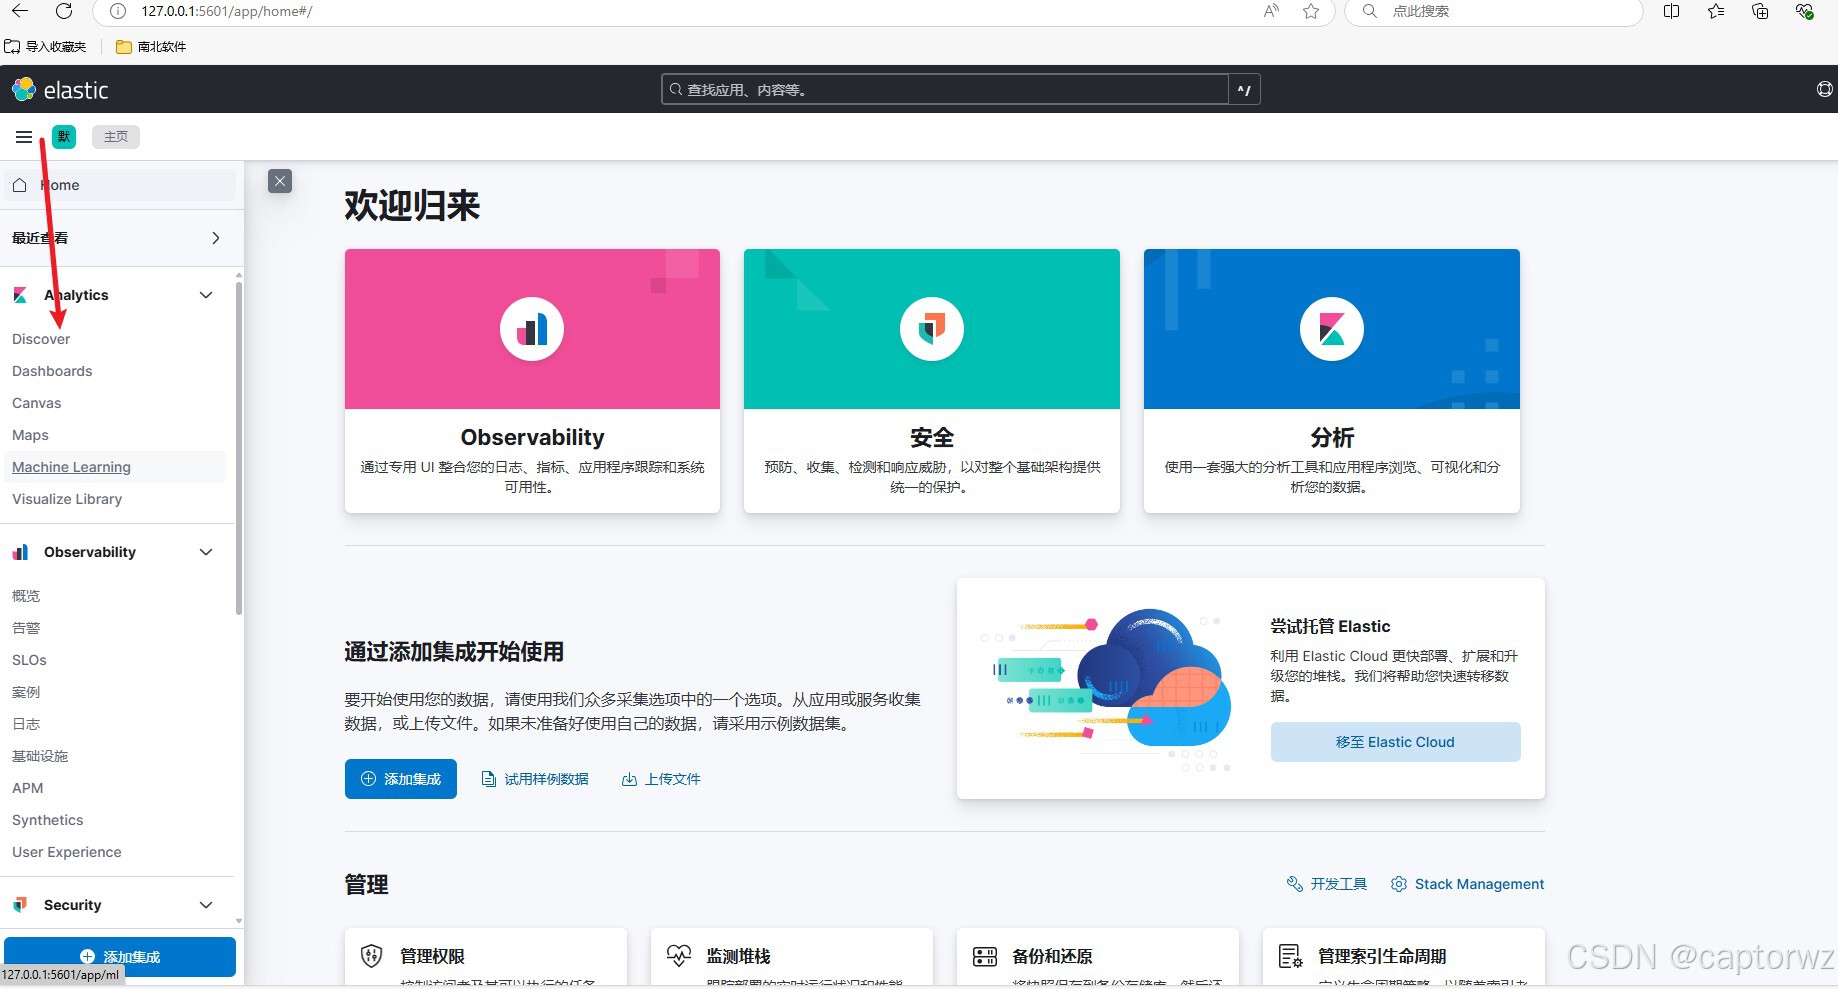
完成设置后,回到首页点击Discover
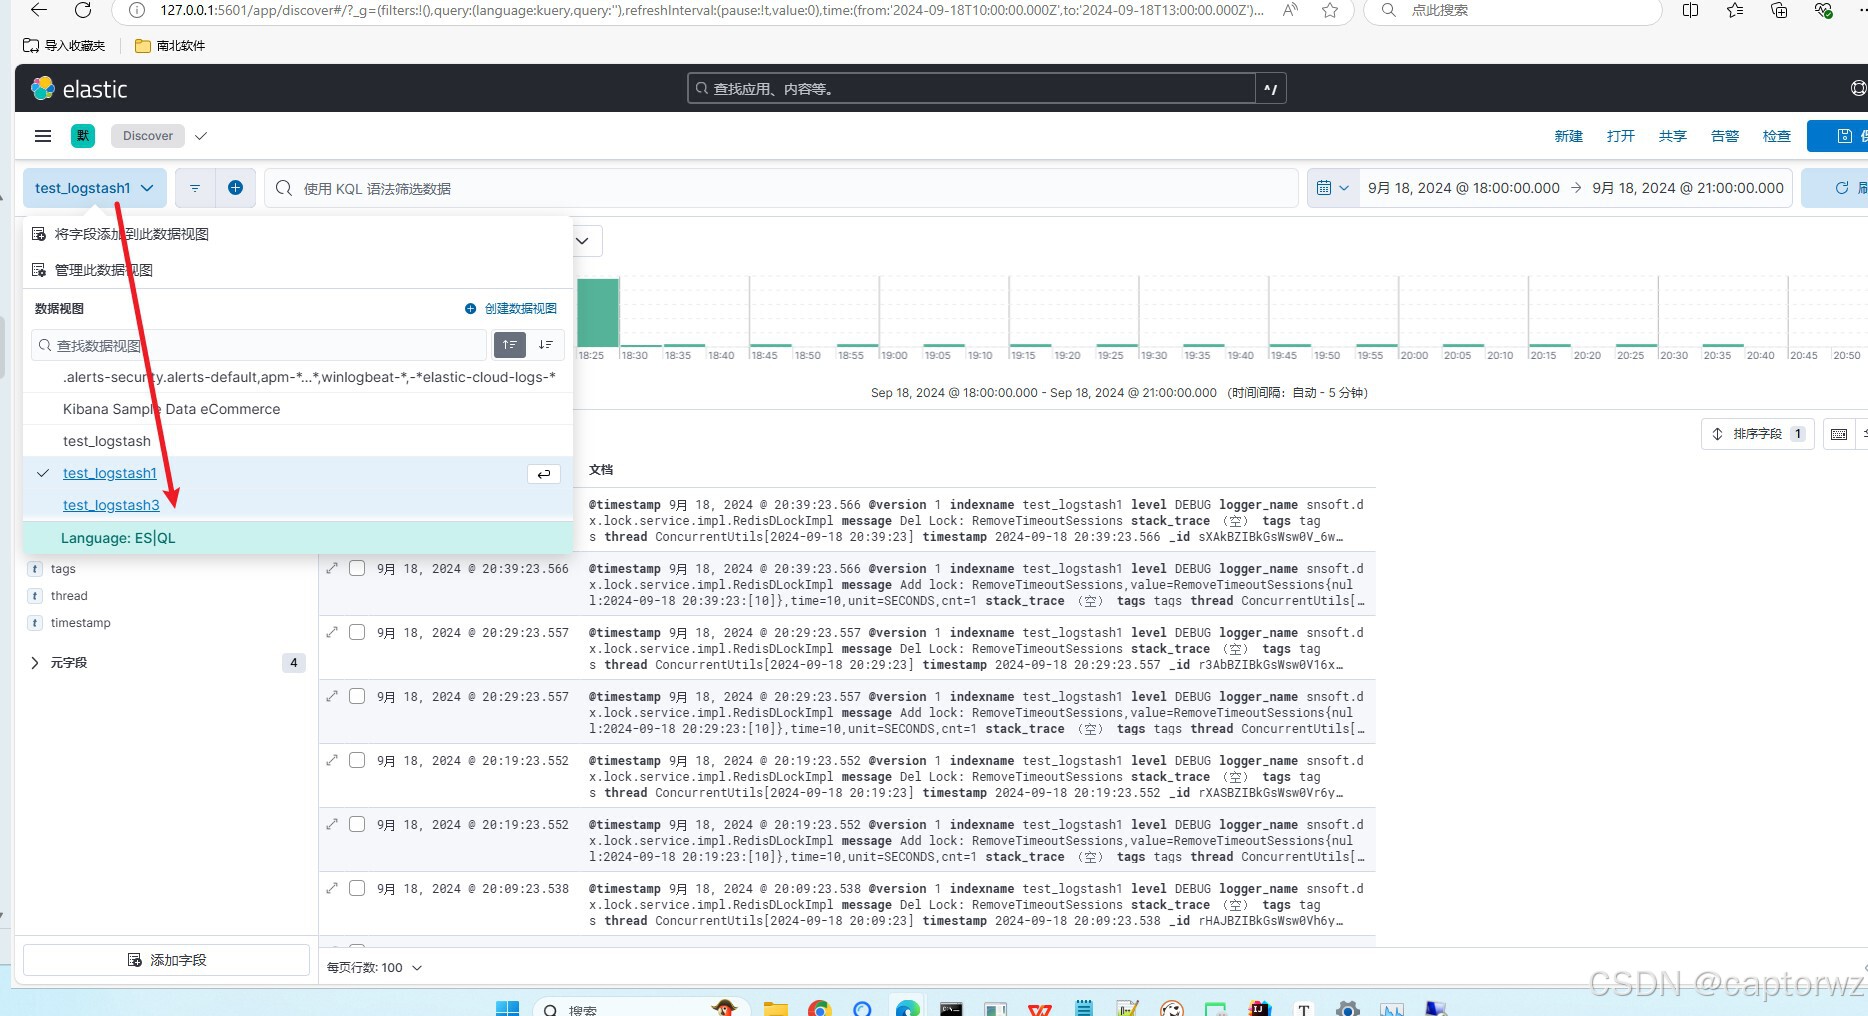
点击下拉如下图切换视图
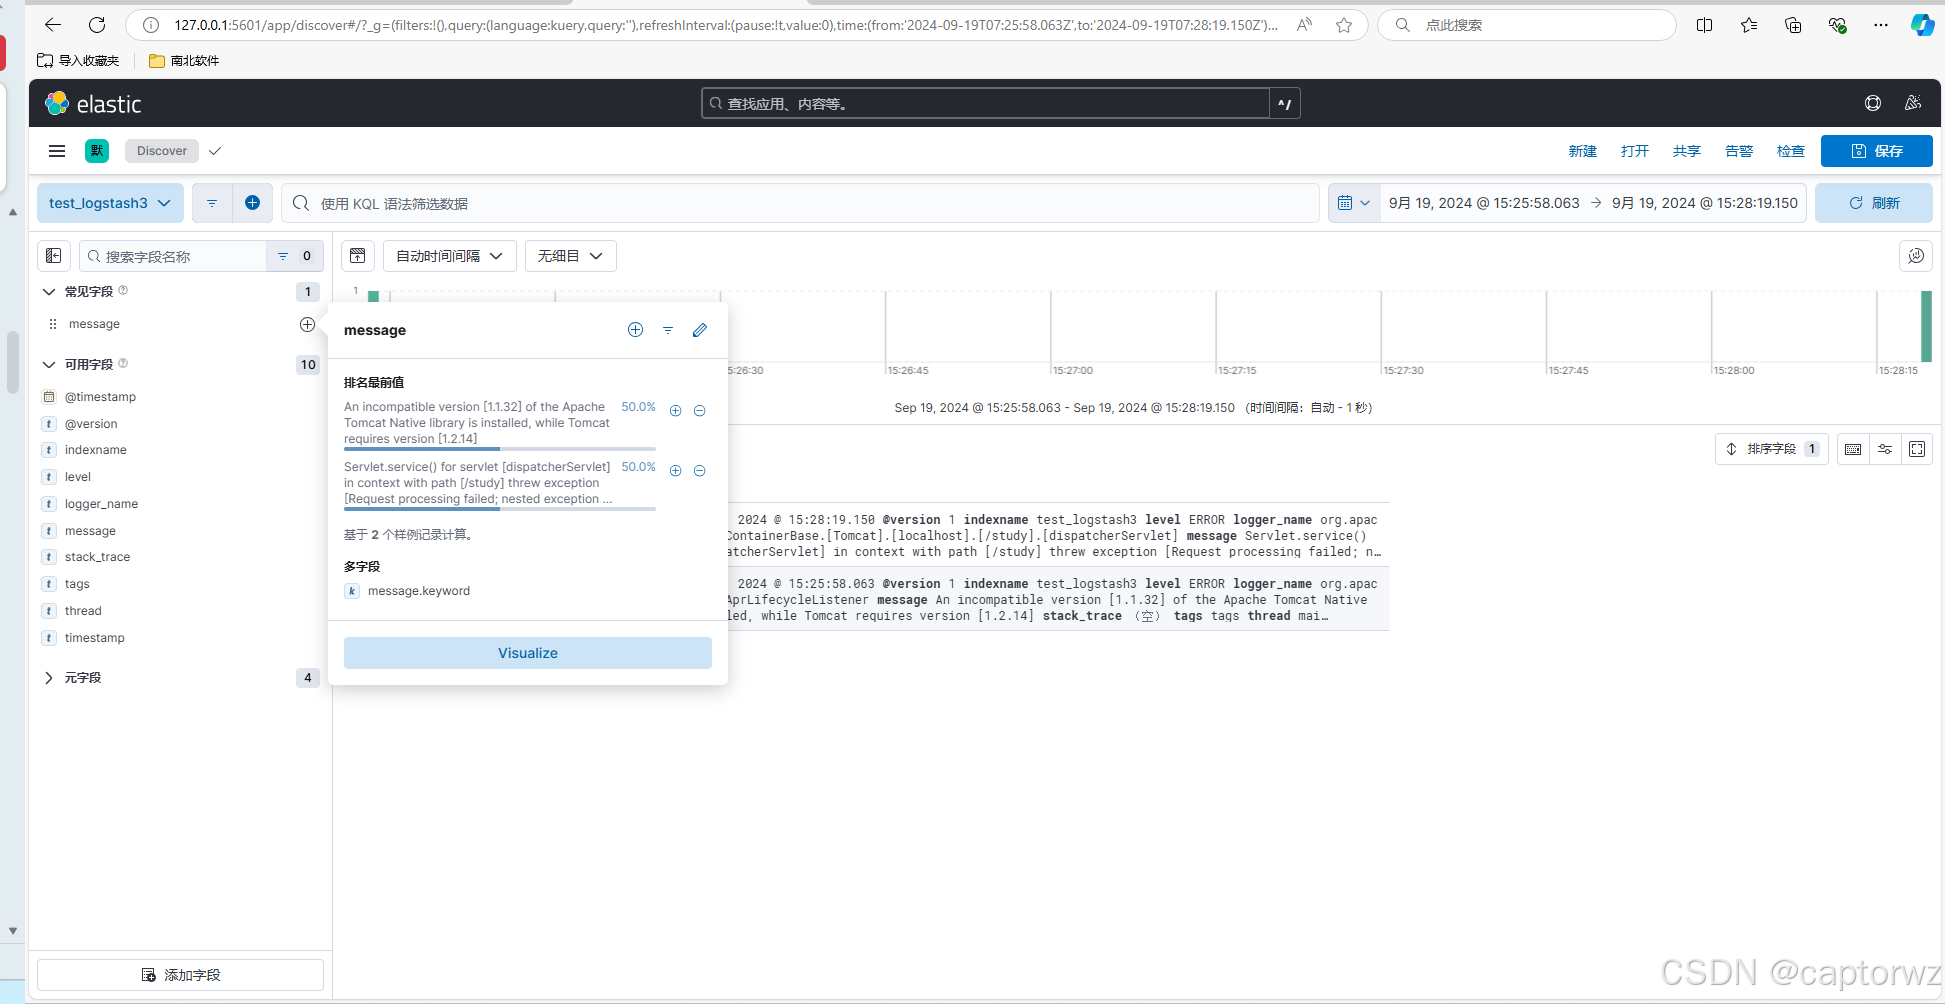
最后展示日志如下图
后续扩展kibana查询统计,以及日志设置


 7205
7205

 被折叠的 条评论
为什么被折叠?
被折叠的 条评论
为什么被折叠?
 到【灌水乐园】发言


