


 本文分享了使用Python进行曲线图绘制的代码,包括常態分佈、sigmoid函数、tanh函数、线性函数和正弦波形等常见曲线的绘制方法,适合数据可视化和机器学习初学者参考。
import math
import matplotlib.pyplot as plt
import numpy as np
import matplotlib as mpl
import scipy.stats
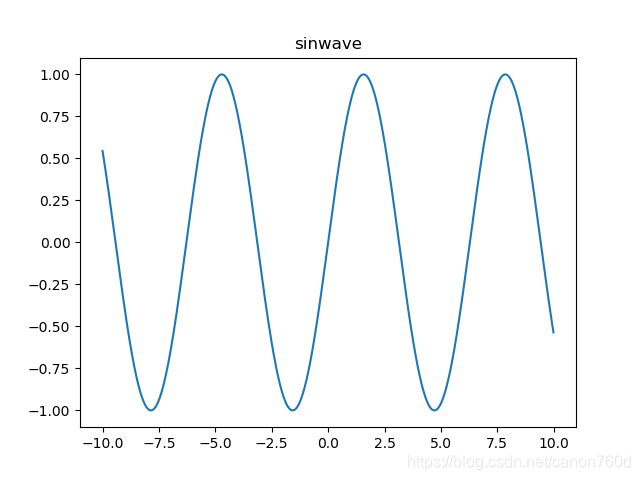
def sinwave(x):
y = np.sin(x)
return y
x=np.arange(-10,10,0.01)
y=sinwave(x)
plt.plot(x,y,label='sinwave')
plt.title('sinwave')
plt.show()
print("------------------------")
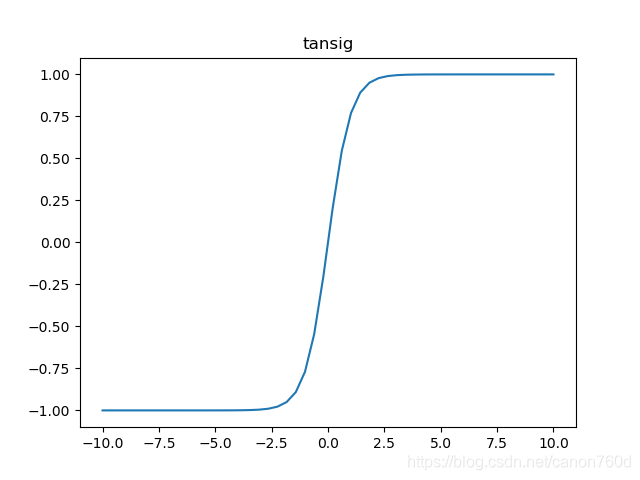
def tansig(x):
y=2/(1+np.exp(-2*x))-1
return y
x = np.linspace(-10, 10)
y = tansig(x)
plt.plot(x,y,label=tansig)
plt.title('tansig')
plt.show()
print("------------------------")
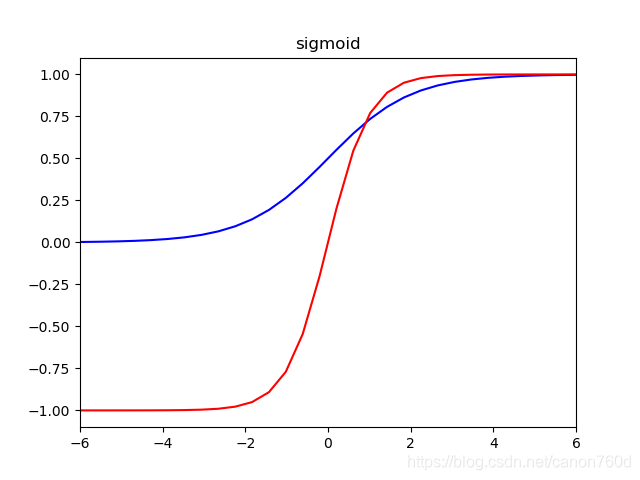
def sigmoid(x):
y=1.0 / (1.0 + np.exp(-x))
return y
x = np.linspace(-10, 10)
y = sigmoid(x)
tanh = 2*sigmoid(2*x) -1
plt.xlim(-6,6)
plt.ylim(-1.1,1.1)
plt.plot(x,y,label="Sigmoid",color = "blue")
plt.plot(x,tanh,label="Tanh", color = "red")
plt.title('sigmoid')
plt.show()
print("------------------------")
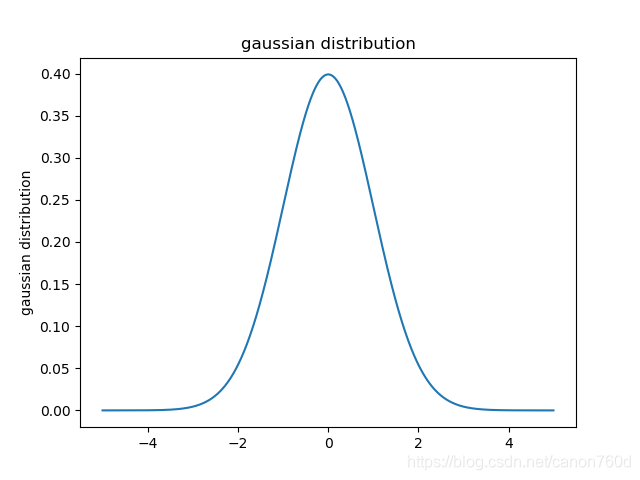
def normal(x): #裡面函數要查
f = np.exp(-np.square(x-mean)/2*variance)/(np.sqrt(2*np.pi*variance))
return f
mean = 0
std = 1
variance = np.square(std)
x = np.arange(-5,5,.01)
f=normal(x)
plt.plot(x,f)
plt.ylabel('gaussian distribution')
plt.title('gaussian distribution')
plt.show()
print("------------------------")
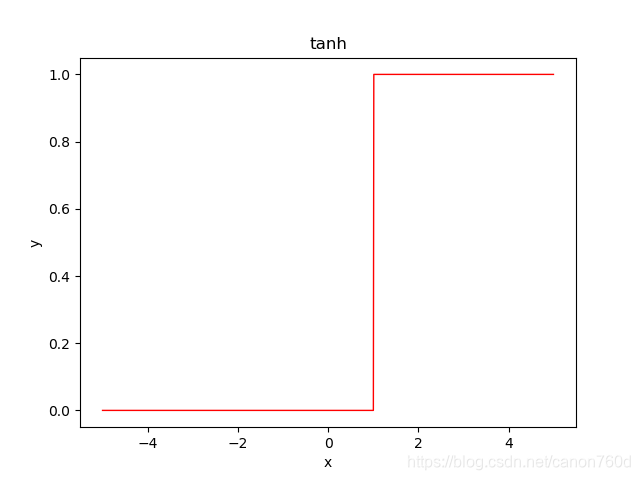
x = np.arange(-5, 5, 0.01)
def tanh(x):
y=np.zeros([len(x)])
for i in range(len(x)):
if x[i]<1: #<1
y[i]=0
else:
y[i] = 1
return y #
y=tanh(x)
plt.plot(x,y,linewidth=1,color='red') #如果要畫在圖上維度必須要一樣,上方y維度要和x維度一樣大才行
plt.xlabel('x')
plt.ylabel('y')
plt.title('tanh')
plt.show()
print("------------------------")
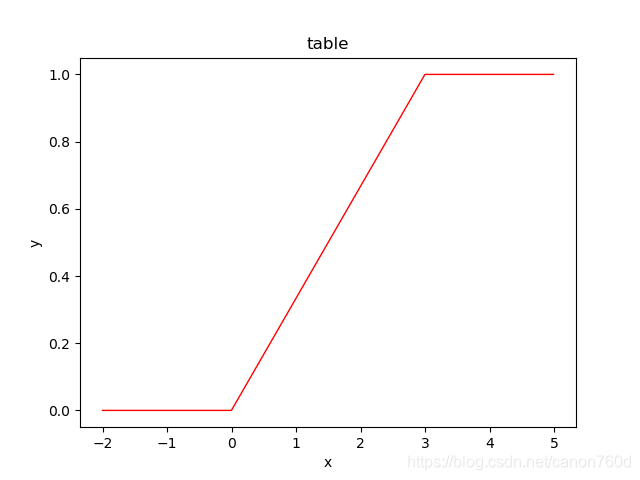
def liner(x):
y=np.zeros([len(x)])
for i in range(len(x)):
if x[i] <= 0 :
y[i]=0
else:
if x[i]>0 and x[i]<=3:
y[i]=np.array(i/300-0.666)
else:
y[i]=1
return y
x = np.arange(-2,5,0.01)
y = liner(x)
plt.plot(x,y,linewidth=1,color='red') #如果要畫在圖上維度必須要一樣,上方y維度要和x維度一樣大才行
plt.xlabel('x')
plt.ylabel('y')
plt.title('table')
plt.show()


 被折叠的 条评论
为什么被折叠?
被折叠的 条评论
为什么被折叠?
 到【灌水乐园】发言


