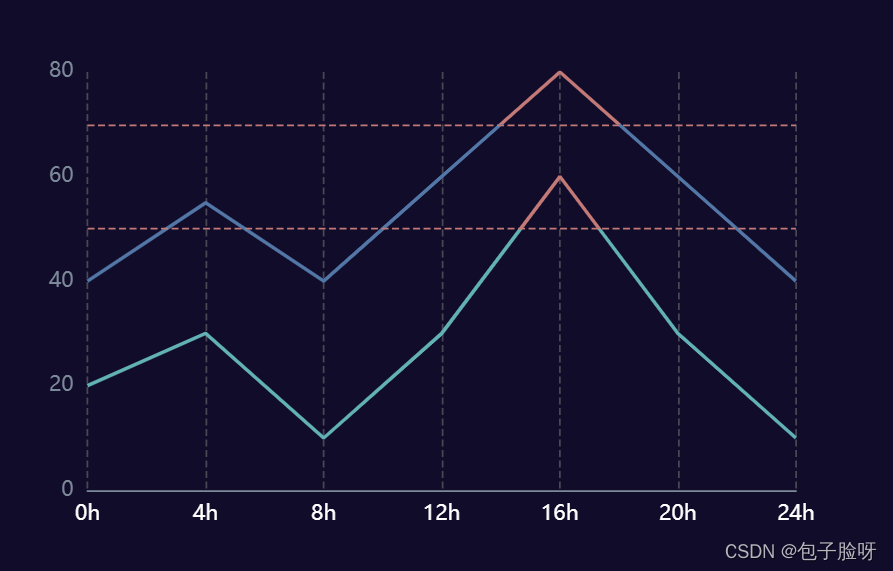
主要用到两个属性:
 visualMap:分段标记,如图中折线红色部分
 markLine:如图中红色标记线
option = {
xAxis: [
{
type: 'category',
data: ['0h', '4h', '8h', '12h', '16h', '20h', '24h'],
boundaryGap: false,
axisTick: {
show: false
},
axisLine: {
show: true,
lineStyle: {
color: '#7c8999'
}
},
axisLabel: {
color: '#fff'
},
splitLine: {
show: true,
lineStyle: {
type: 'dashed'
}
}
}
],
yAxis: [
{
type: 'value',
axisLabel: {
color: '#7c8999'
},
axisLine: {
show: false
},
splitLine: {
show: false
}
}
],
visualMap: [
{
show: false,
type: 'piecewise',
seriesIndex: 0,
pieces: [
{
gt: 50,
color: '#c37976'
},
{
gt: 0,
lte: 50,
color: '#62b2b5'
}
]
},
{
show: false,
type: 'piecewise',
seriesIndex: 1,
pieces: [
{
gt: 70,
color: '#c37976'
},
{
gt: 0,
lte: 70,
color: '#5276a6'
}
]
}
],
series: [
{
name: '平均',
type: 'line',
data: [20, 30, 10, 30, 60, 30, 10],
showSymbol: false,
markLine: {
silent: true,
symbol: false,
lineStyle: {
color: '#c37976'
},
data: [
{
yAxis: 50
}
],
label: {
show: false
}
}
},
{
name: '平均温度',
type: 'line',
data: [40, 55, 40, 60, 80, 60, 40],
showSymbol: false,
markLine: {
silent: true,
symbol: false,
lineStyle: {
color: '#c37976'
},
data: [
{
yAxis: 70
}
],
label: {
show: false
}
}
}
]
};


 939
939

 被折叠的 条评论
为什么被折叠?
被折叠的 条评论
为什么被折叠?
 到【灌水乐园】发言


