


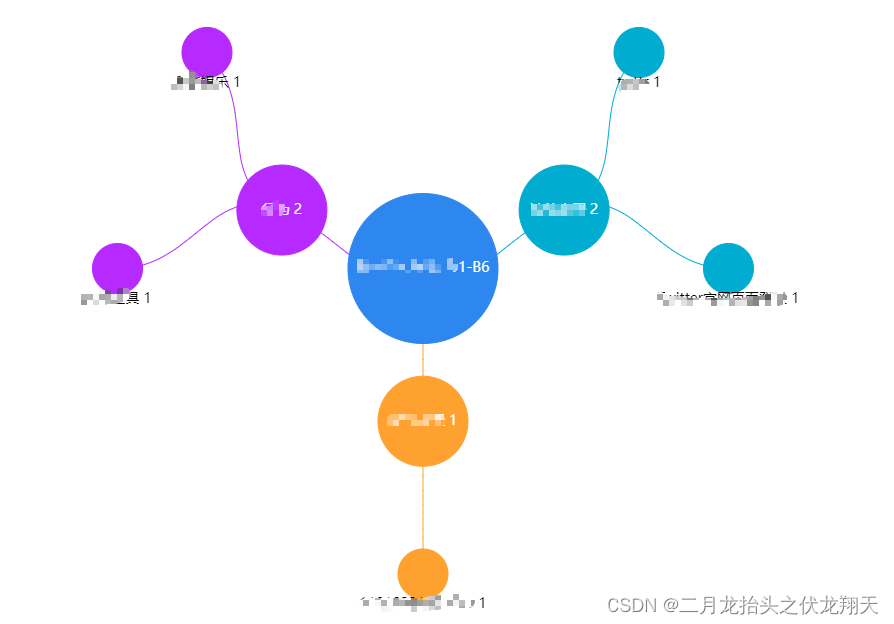
一、效果图
二、实现
1、数据
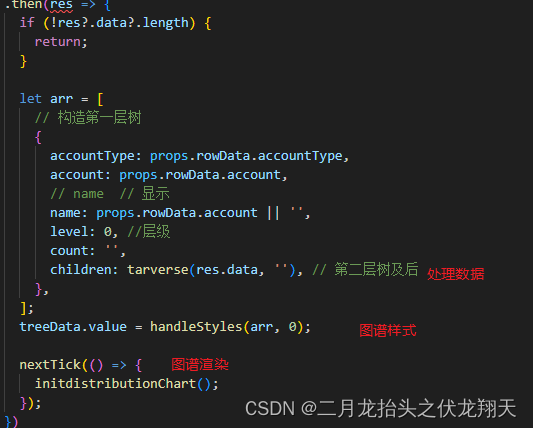
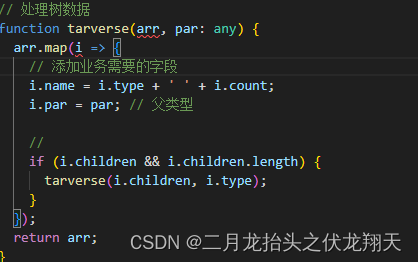
2、数据处理
3、样式处理
var colors = ['#00ADD0', '#FFA12F', '#B62AFF', '#604BFF', '#95F300'];
// 样式
function handleStyles(data: any, index: any, color = 'rgb(46, 135, 239)') {
  //index标识第几层
  return data.map((item: any, index2: any) => {
    //计算出第1级颜色
    if (index == 0) {
      color = 'rgb(46, 135, 239)';
    }
    if (index == 1) {
      // 5个二级  自己下级 相同颜色
      color = colors.find((item, eq) => eq == index2 % 5);
    }
    // 第三级继承父级第二级颜色  所以参数color  也可以在自定义
    // if (index == 2) { }

    // 设置节点大小
    if (index === 0 || index === 1) {
      item.label = {
        position: 'inside',
      };
    } else {
      // 三级
      item.label = {
        position: 'bottom', // 1 inside  outside
        //2 以像素为单位,第一个参数为x轴方向,
        // 第二个参数为y轴方向,左上角为起点,向右向下为正数,向上向左为负数。
        // position: [10, 60],

        // 3 以百分比为单位,注意百分比需要用引号包裹,第一个参数为x轴方向,第二个参数为y轴方向,左上角为起点,向右向下为正数,向上向左为负数。
        // position:['2%', '5%'],

        color: '#000',

        // rotate: 0,
        //   borderRadius: "50%",
      };
    }
    // 设置节点大小 size
    switch (index) {
      case 0:
        item.symbolSize = 150;
        break;
      case 1:
        item.symbolSize = 90;
        break;
      case 2:
        item.symbolSize = 50;
        break;
      default:
        item.symbolSize = 40;
        break;
    }

    // 设置线条颜色
    item.lineStyle = { color: color };

    if (item.children) {
      //存在子节点
      item.itemStyle = {
        borderColor: color,
        color: color,
      };
      item.children = handleStyles(item.children, index + 1, color);
    } else {
      //不存在
      item.itemStyle = {
        // color: 'transparent',
        color: color,
        borderColor: color,
      };
    }
    return item;
  });
}
4、echarts的option配置
{
    type: 'tree', // tree
    // backgroundColor: '#000',// 整个树图谱背景色  默认白色
    tooltip: {
      //提示框  // 触发方式 mousemove, click, none, mousemove|click
      triggerOn: 'mousemove',
      // item 图形触发, axis 坐标轴触发, none 不触发 // triggerOn: 'click',
      trigger: 'item',

      formatter: (params: any) => {
        return params.name; // 可以<div></div>
      },
    },
    series: [
      {
        type: 'tree',
        hoverAnimation: true, //hover样式  true
        data: treeData.value, //
        // 整个图谱位置比例
        top: 30, //0
        bottom: 60, // 0
        left: 0,
        right: 0,
        // 布局
        layout: 'radial',
        symbol: 'circle',
        symbolSize: 10, // 节点大小
        //
        // nodePadding的数组值为[10, 20],表示第一层节点与第二层节点之间的水平间距为10,垂直间距为20。
        nodePadding: 20, // 20
        animationDurationUpdate: 550, // 动画过渡时间  毫秒
        expandAndCollapse: false, //子树折叠和展开的交互,默认打开
        initialTreeDepth: 2, // 设置树状图的初始展示层数
        roam: true, //是否开启鼠标缩放和平移漫游。scale/move/true
        focusNodeAdjacency: true, //
        //节点样式
        itemStyle: {
          borderWidth: 1,
          // borderColor
          // color
        },
        // 节点内文字标签
        label: {
          // show: false, // 控制展示

          //标签样式
          // color: '#000',
          color: '#fff',

          fontSize: 14,

          position: 'inside', // outside
          rotate: 0, // 倾斜

          // 默认展示 不写也是params.name
          formatter: (params: any) => {
            //   不可用div
            return params.name;
          },
        },
        // 线样式
        lineStyle: {
          width: 1,
          curveness: 0.5,
        },
      },
    ],
  };
三、参考
1、关系图
2、位置配置
ECharts 中设置position配置项所在位置(外部,内部,自定义位置)_echarts position_咸鱼!的博客-优快云博客


 4万+
4万+

 被折叠的 条评论
为什么被折叠?
被折叠的 条评论
为什么被折叠?
 到【灌水乐园】发言


