


 热力图能够清晰展示密集点位置及属性值的分布情况,适用于处理大量重叠点数据。通过选择热力图样式并调整参数,可以有效增强地图上特征的可见性和理解性。
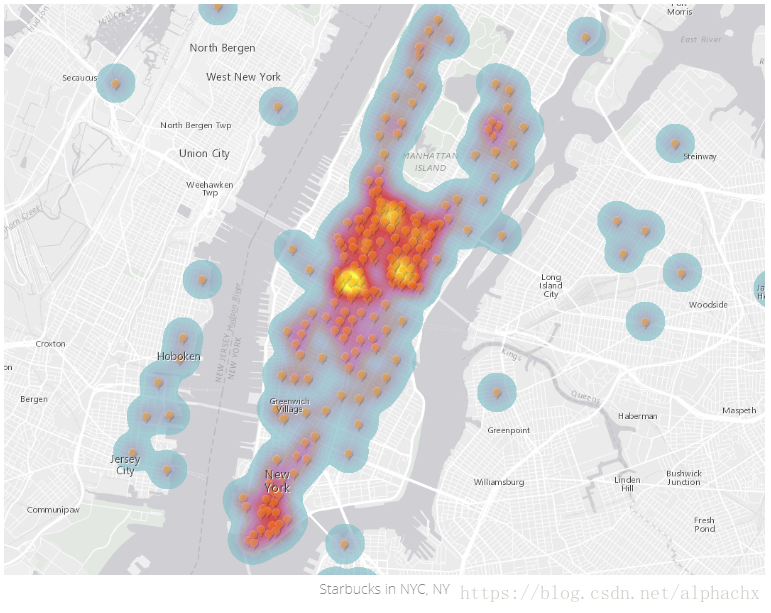
Heat mapping allows us to see the location and distribution of features. Are you most interested in
- where many points are located or
- where high and low values for a particular attribute are clustered?
Heat maps can answer both these questions.
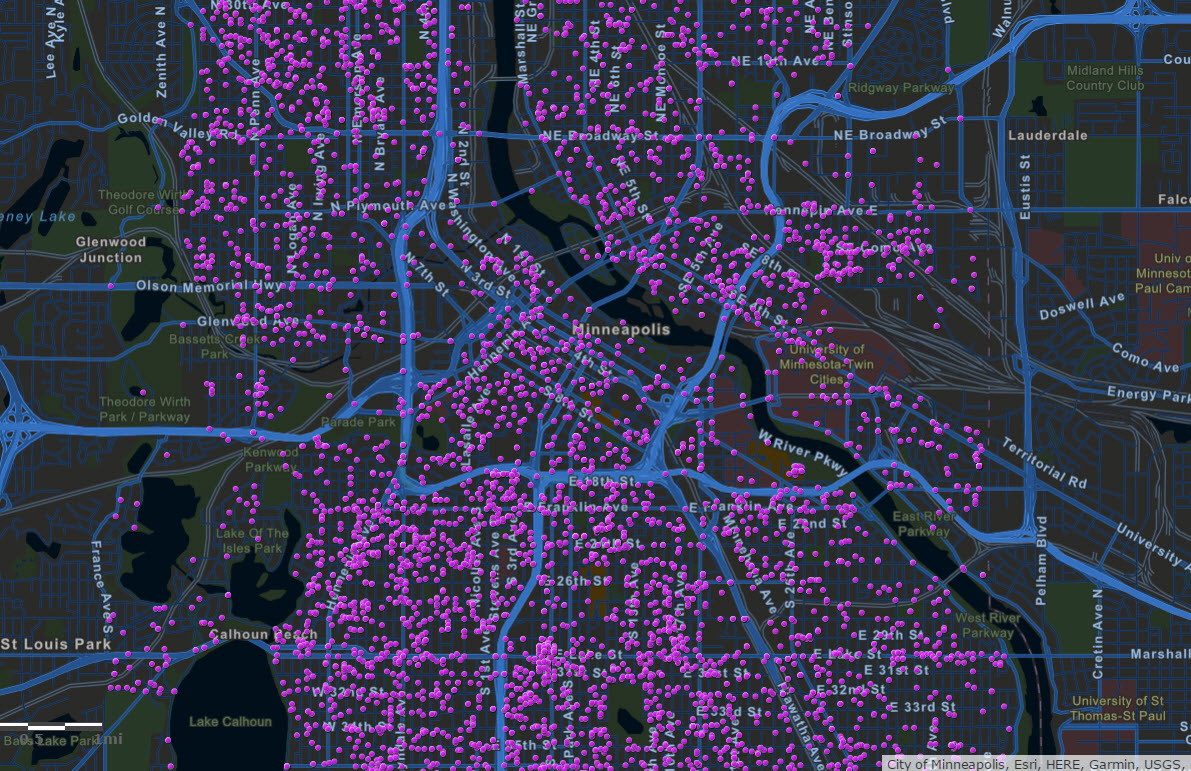
They are particularly useful when many of the points on the map are close together or overlapping, making it difficult to distinguish between features. Heat maps are also effective for displaying layers that contain a large number of points such as the example below.
It’s as easy as two simple steps!
1. Select Heat Map style
2. Explore the options


 4632
4632

 被折叠的 条评论
为什么被折叠?
被折叠的 条评论
为什么被折叠?
 到【灌水乐园】发言


