


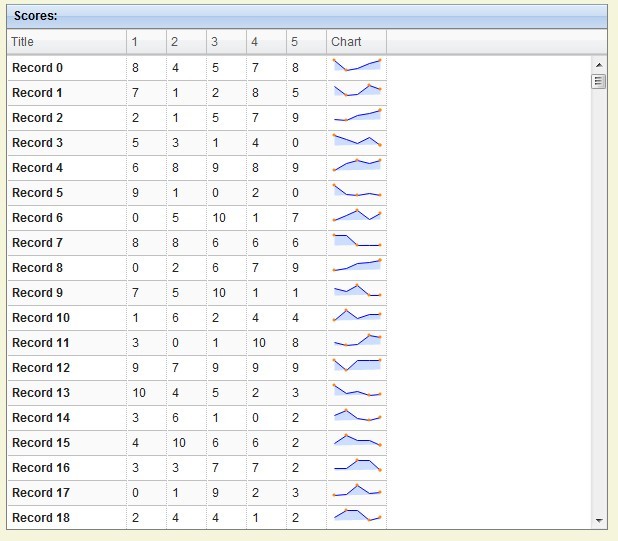
 本文介绍如何在SlickGrid中集成Sparkline库来创建动态图表,展示了一个包含500行数据的表格,每行包含一个标题和五个整数,后面跟着这些整数的图形表示。使用CANVAS元素在后台绘制图表,表格可编辑,数值更改会立即反映在图表中。
根据数据生成折线图,使用相当简单,也很容易。
主要方法:
数据:
var vals = [12,32,5,67,5,43,76,32,5];
生成折线图:
$("testid").empty().sparkline(vals, {width: "100%"});
然后折线图就出来了,是不是相当简单啊?
代码:
<!DOCTYPE HTML>
<html>
<head>
  <meta http-equiv="Content-Type" content="text/html; charset=iso-8859-1">
  <title>SlickGrid example 10: Async post render</title>
  <link rel="stylesheet" href="../slick.grid.css" type="text/css"/>
  <link rel="stylesheet" href="../css/smoothness/jquery-ui-1.8.16.custom.css" type="text/css"/>
  <link rel="stylesheet" href="examples.css" type="text/css"/>
  <style>
    .cell-title {
      font-weight: bold;
    }

    .cell-effort-driven {
      text-align: center;
    }

    .description * {
      font-size: 11pt;
    }
  </style>
</head>
<body>
<div style="width:600px;float:left;">
  <div class="grid-header" style="width:100%">
    <label>Scores:</label>
  </div>
  <div id="myGrid" style="width:100%;height:500px;"></div>
</div>

<div style="margin-left:650px;margin-top:40px;" class="description">
  <h2>Demonstrates:</h2>

  <p>
    With SlickGrid, you can still have rich, complex cells rendered against the actual DOM nodes while still preserving
    the speed and responsiveness.
    This is achieved through async background post-rendering.
    SlickGrid exposes a <u>asyncPostRender</u> property on a column which you can use to set your own function that will
    manipulate the cell DOM node directly.
    The event is fired one by one for all visible rows in the viewport on a timer so it doesn't impact the UI
    responsiveness.
    You should still make sure that post-processing one row doesn't take too long though.
    SlickGrid will figure out what and when needs to be updated for you.
  </p>

  <p>
    The example below is a list of 500 rows with a title and 5 integer cells followed by graphical representation of
    these integers.
    The graph is drawn using a CANVAS element in the background.
    The grid is editable, so you can edit the numbers and see the changes reflected (almost) immediately in the graph.
    The graph cell behaves just like an ordinary cell and can be resized/reordered.
    The graphs themselves are created using the excellent <a href="http://www.omnipotent.net/jquery.sparkline/"
                                                             target="_blank">jQuery Sparklines</a> library.
  </p>
</div>

<script src="../lib/firebugx.js"></script>

<script src="../lib/jquery-1.7.min.js"></script>
<script src="../lib/jquery-ui-1.8.16.custom.min.js"></script>
<script src="../lib/jquery.event.drag-2.0.min.js"></script>
<script src="../lib/jquery.sparkline.min.js"></script>

<script src="../slick.core.js"></script>
<script src="../slick.editors.js"></script>
<script src="../slick.grid.js"></script>

<script>
  function requiredFieldValidator(value) {
    if (value == null || value == undefined || !value.length) {
      return {valid: false, msg: "This is a required field"};
    } else {
      return {valid: true, msg: null};
    }
  }

  function waitingFormatter(value) {
    return "wait...";
  }

  function renderSparkline(cellNode, row, dataContext, colDef) {
    var vals = [
      dataContext["n1"],
      dataContext["n2"],
      dataContext["n3"],
      dataContext["n4"],
      dataContext["n5"]
    ];

    $(cellNode).empty().sparkline(vals, {width: "100%"});
  }

  var grid;
  var data = [];
  var columns = [
    {id: "title", name: "Title", field: "title", sortable: false, width: 120, cssClass: "cell-title"},
    {id: "n1", name: "1", field: "n1", sortable: false, editor: Slick.Editors.Integer, width: 40, validator: requiredFieldValidator},
    {id: "n2", name: "2", field: "n2", sortable: false, editor: Slick.Editors.Integer, width: 40, validator: requiredFieldValidator},
    {id: "n3", name: "3", field: "n3", sortable: false, editor: Slick.Editors.Integer, width: 40, validator: requiredFieldValidator},
    {id: "n4", name: "4", field: "n4", sortable: false, editor: Slick.Editors.Integer, width: 40, validator: requiredFieldValidator},
    {id: "n5", name: "5", field: "n5", sortable: false, editor: Slick.Editors.Integer, width: 40, validator: requiredFieldValidator},
    {id: "chart", name: "Chart", sortable: false, width: 60, formatter: waitingFormatter, rerenderOnResize: true, asyncPostRender: renderSparkline}
  ];

  var options = {
    editable: true,
    enableAddRow: false,
    enableCellNavigation: true,
    asyncEditorLoading: false,
    enableAsyncPostRender: true
  };


  $(function () {
    for (var i = 0; i < 500; i++) {
      var d = (data[i] = {});

      d["title"] = "Record " + i;
      d["n1"] = Math.round(Math.random() * 10);
      d["n2"] = Math.round(Math.random() * 10);
      d["n3"] = Math.round(Math.random() * 10);
      d["n4"] = Math.round(Math.random() * 10);
      d["n5"] = Math.round(Math.random() * 10);
    }

    grid = new Slick.Grid("#myGrid", data, columns, options);
  })
</script>
</body>
</html>


 被折叠的 条评论
为什么被折叠?
被折叠的 条评论
为什么被折叠?
 到【灌水乐园】发言


