


在纳秒优化训练营北京站的课堂上,大家使用perf做试验时发现了一个BUG,更重要的是,当场证明了这一定是BUG,因为眼力过人的李博士看出是用小核的时钟数去除大核的指令数,指桑骂槐,张冠李戴。
在perf这个非常专业的优化工具里,出现如此“通俗易懂”的BUG让大家都笑出声来,也让我瞠目结舌,甚至开玩笑说:“今晚要找出这个BUG来”。
当晚我真的打开了perf的源代码,就在Linux代码树的tools\perf目录下。但是,当我搜索一番后,很快就觉得是自己给自己挖了个陷阱。搜索手头的内核代码,根本没找到cpu_core和cpu_atom这样的字符串。
更重要的是,我没把可以复现BUG的本子带回酒店,没法精确下载出问题版本的源代码,也没法上调试器。 考虑到第二天还要上课,只好放弃了。
上GDB
回到上海后的周一晚上,吃过晚饭,我准备再找一下这个BUG。先尝试上gdb。
遇到的第一个障碍是直接gdb perf时gdb报错,因为perf是个脚本。
"/usr/bin/perf": not in executable format: file format not recognized执行perf top让perf长时间运行,再ps aux找到完整的命令行:
root 42931 8.8 0.2 625240 78632 pts/3 Sl+ 21:16 0:01 /usr/lib/linux-tools/6.11.0-26-generic/perf top
再使用ll观察:
lrwxrwxrwx 1 root root 41 Apr 17 23:16 /usr/lib/linux-tools/6.11.0-26-generic/perf -> ../../linux-hwe-6.11-tools-6.11.0-26/perf*
这下找到它的可执行文件:/usr/lib/linux-hwe-6.11-tools-6.11.0-26/perf
接下来再上gdb,对write设置断点,就可以看到perf stat输出信息的过程了。
(gdb) bt#0 __GI___libc_write (fd=2, buf=0x7ffff6404563 <_IO_2_1_stderr_+131>, nbytes=1) at ../sysdeps/unix/sysv/linux/write.c:25#1 0x00007ffff6293975 in _IO_new_file_write (f=0x7ffff64044e0 <_IO_2_1_stderr_>, data=0x7ffff6404563 <_IO_2_1_stderr_+131>, n=1) at ./libio/fileops.c:1181#2 0x00007ffff6292571 in new_do_write (to_do=1, data=0x7ffff6404563 <_IO_2_1_stderr_+131> "\n", fp=0x7ffff64044e0 <_IO_2_1_stderr_>) at ./libio/libioP.h:1030#3 _IO_new_do_write (fp=fp@entry=0x7ffff64044e0 <_IO_2_1_stderr_>, data=0x7ffff6404563 <_IO_2_1_stderr_+131> "\n", to_do=1) at ./libio/fileops.c:426#4 0x00007ffff6292ef3 in _IO_new_file_overflow (f=0x7ffff64044e0 <_IO_2_1_stderr_>, ch=10) at ./libio/fileops.c:784#5 0x000055555578b255 in evlist.print_counters ()#6 0x00005555555be8df in cmd_stat ()#7 0x000055555561c072 in run_builtin ()#8 0x000055555561c37b in handle_internal_command ()#9 0x000055555559b77c in main ()(gdb)这样调试的效率不高,因为perf模块没有DWARF格式的符号。
重新编译
为了提高调试效率和找到包含BUG的源代码,我决定下载代码包,重新编译。
先使用apt source linux-tools-common下载源代码。
geduer@lunabook:~$ apt source linux-tools-commonReading package lists... DonePicking 'linux' as source package instead of 'linux-tools-common'NOTICE: 'linux' packaging is maintained in the 'Git' version control system at:git://git.launchpad.net/~ubuntu-kernel/ubuntu/+source/linux/+git/noblePlease use:git clone git://git.launchpad.net/~ubuntu-kernel/ubuntu/+source/linux/+git/nobleto retrieve the latest (possibly unreleased) updates to the package.Need to get 235 MB of source archives.Get:1 http://archive.ubuntu.com/ubuntu noble-updates/main linux 6.8.0-60.63 (dsc) [9,342 B]Get:2 http://archive.ubuntu.com/ubuntu noble-updates/main linux 6.8.0-60.63 (tar) [230 MB]再安装构建内核时常用的依赖包,使用make命令编译。
有个错误:
In file included from /home/geduer/linux-6.8.0/tools/perf/util/evsel.c:43:/home/geduer/linux-6.8.0/tools/perf/util/trace-event.h:149:62: error: operator '&&' has no right operand 149 | #if defined(LIBTRACEEVENT_VERSION) && LIBTRACEEVENT_VERSION >= MAKE_LIBTRACEEVENT_VERSION(1, 5, 0) | ^~error: command '/usr/bin/gcc' failed with exit code 1看起来是缺少LIBTRACEEVENT_VERSION定义,先使用pkgconf找到libtraceevent包的版本。
geduer@lunabook:~$ pkgconf --modversion libtraceevent1.8.2再使用export命令定义一个环境变量:
export LIBTRACEEVENT_VERSION=1.8.2
然后再编译,顺利通过,但是仍没有DWARF符号。
搜索了一下Makefile,看起来是要加DEBUG选项,使用make DEBUG=1编译,这下有详细符号了。
再使用gdb调试,这下有类型化的参数和源代码信息,效率高多了。
(gdb) bt#0 __GI___libc_write (fd=2, buf=0x7fffffffba60, nbytes=32) at ../sysdeps/unix/sysv/linux/write.c:25#1 0x00007ffff6c93975 in _IO_new_file_write (f=0x7ffff6e044e0 <_IO_2_1_stderr_>, data=0x7fffffffba60, n=32) at ./libio/fileops.c:1181#2 0x00007ffff6c93bda in new_do_write (to_do=<optimized out>, data=0x7fffffffba60 "cpu_core/instructions/ л\377\377\377\177", fp=0x7ffff6e044e0 <_IO_2_1_stderr_>) at ./libio/libioP.h:1030#3 _IO_new_file_xsputn (n=32, data=<optimized out>, f=<optimized out>) at ./libio/fileops.c:1255#4 _IO_new_file_xsputn (f=0x7ffff6e044e0 <_IO_2_1_stderr_>, data=<optimized out>, n=32) at ./libio/fileops.c:1197#5 0x00007ffff6c60cc9 in __printf_buffer_flush_to_file (buf=0x7fffffffba30) at ../libio/libioP.h:1030#6 __printf_buffer_to_file_done (buf=buf@entry=0x7fffffffba30) at ./stdio-common/printf_buffer_to_file.c:120#7 0x00007ffff6c6b743 in __vfprintf_internal (s=0x7ffff6e044e0 <_IO_2_1_stderr_>, format=0x55555591bc23 "%-*s", ap=ap@entry=0x7fffffffbb30, mode_flags=mode_flags@entry=0) at ./stdio-common/vfprintf-internal.c:1545#8 0x00007ffff6c5f5fc in __fprintf (stream=<optimized out>, format=<optimized out>) at ./stdio-common/fprintf.c:32#9 0x00005555557a3e0b in print_counter_value_std (config=0x555555fc34a0 <stat_config>, evsel=0x55555600bdc0, avg=453659477297, ok=true) at util/stat-display.c:668#10 0x00005555557a415a in print_counter_value (config=0x555555fc34a0 <stat_config>, evsel=0x55555600bdc0, avg=453659477297, ok=true) at util/stat-display.c:716#11 0x00005555557a421f in abs_printout (config=0x555555fc34a0 <stat_config>, id=..., aggr_nr=1, evsel=0x55555600bdc0, avg=453659477297, ok=true) at util/stat-display.c:724#12 0x00005555557a468a in printout (config=0x555555fc34a0 <stat_config>, os=0x7fffffffbf30, uval=453659477297, run=52495482369, ena=88210551648, noise=453659477297, aggr_idx=0) at util/stat-display.c:816#13 0x00005555557a501d in print_counter_aggrdata (config=0x555555fc34a0 <stat_config>, counter=0x55555600bdc0, aggr_idx=0, os=0x7fffffffbf30) at util/stat-display.c:1000#14 0x00005555557a5569 in print_counter (config=0x555555fc34a0 <stat_config>, counter=0x55555600bdc0, os=0x7fffffffbf30) at util/stat-display.c:1110#15 0x00005555557a6fc8 in evlist__print_counters (evlist=0x555555ffe940, config=0x555555fc34a0 <stat_config>, _target=0x555555fbee20 <target>, ts=0x0, argc=1, argv=0x7fffffffe490) at util/stat-display.c:1575#16 0x00005555555f27a6 in print_counters (ts=0x0, argc=1, argv=0x7fffffffe490) at builtin-stat.c:1003#17 0x00005555555f71e1 in cmd_stat (argc=1, argv=0x7fffffffe490) at builtin-stat.c:2864#18 0x00005555556cedba in run_builtin (p=0x555555fc5cb0 <commands+336>, argc=2, argv=0x7fffffffe490) at perf.c:349#19 0x00005555556cf050 in handle_internal_command (argc=2, argv=0x7fffffffe490) at perf.c:402#20 0x00005555556cf1ae in run_argv (argcp=0x7fffffffe2ac, argv=0x7fffffffe2a0) at perf.c:446--Type <RET> for more, q to quit, c to continue without paging--#21 0x00005555556cf4f4 in main (argc=2, argv=0x7fffffffe490) at perf.c:562拦截打印
还是对write函数设置断点,拦截perf向屏幕输出信息的操作。这样很快就找到了输出insn per cycle的关键过程。
(gdb) bt#0 __GI___libc_write (fd=2, buf=0x7fffffffba10, nbytes=8) at ../sysdeps/unix/sysv/linux/write.c:25#1 0x00007ffff6c93975 in _IO_new_file_write (f=0x7ffff6e044e0 <_IO_2_1_stderr_>, data=0x7fffffffba10, n=8) at ./libio/fileops.c:1181#2 0x00007ffff6c93bda in new_do_write (to_do=<optimized out>, data=0x7fffffffba10 " 2.74 \n", fp=0x7ffff6e044e0 <_IO_2_1_stderr_>) at ./libio/libioP.h:1030#3 _IO_new_file_xsputn (n=8, data=<optimized out>, f=<optimized out>) at ./libio/fileops.c:1255#4 _IO_new_file_xsputn (f=0x7ffff6e044e0 <_IO_2_1_stderr_>, data=<optimized out>, n=8) at ./libio/fileops.c:1197#5 0x00007ffff6c60cc9 in __printf_buffer_flush_to_file (buf=0x7fffffffb9e0) at ../libio/libioP.h:1030#6 __printf_buffer_to_file_done (buf=buf@entry=0x7fffffffb9e0) at ./stdio-common/printf_buffer_to_file.c:120#7 0x00007ffff6c6b743 in __vfprintf_internal (s=0x7ffff6e044e0 <_IO_2_1_stderr_>, format=0x55555591b628 "%7.2f ", ap=ap@entry=0x7fffffffbae0, mode_flags=mode_flags@entry=0) at ./stdio-common/vfprintf-internal.c:1545#8 0x00007ffff6c5f5fc in __fprintf (stream=<optimized out>, format=<optimized out>) at ./stdio-common/fprintf.c:32#9 0x00005555557a2e5c in print_metric_std (config=0x555555fc34a0 <stat_config>, ctx=0x7fffffffbf30, color=0x0, fmt=0x55555591b628 "%7.2f ", unit=0x55555591b619 "insn per cycle", val=2.7426394482889256) at util/stat-display.c:414#10 0x00005555557a0680 in print_instructions (config=0x555555fc34a0 <stat_config>, evsel=0x55555600bdc0, aggr_idx=0, instructions=453659477297, out=0x7fffffffbda0) at util/stat-shadow.c:322#11 0x00005555557a1684 in perf_stat__print_shadow_stats (config=0x555555fc34a0 <stat_config>, evsel=0x55555600bdc0, avg=453659477297, aggr_idx=0, out=0x7fffffffbda0, metric_events=0x555555fc35c0 <stat_config+288>) at util/stat-shadow.c:678#12 0x00005555557a484a in printout (config=0x555555fc34a0 <stat_config>, os=0x7fffffffbf30, uval=453659477297, run=52495482369, ena=88210551648, noise=453659477297, aggr_idx=0) at util/stat-display.c:846#13 0x00005555557a501d in print_counter_aggrdata (config=0x555555fc34a0 <stat_config>, counter=0x55555600bdc0, aggr_idx=0, os=0x7fffffffbf30) at util/stat-display.c:1000#14 0x00005555557a5569 in print_counter (config=0x555555fc34a0 <stat_config>, counter=0x55555600bdc0, os=0x7fffffffbf30) at util/stat-display.c:1110#15 0x00005555557a6fc8 in evlist__print_counters (evlist=0x555555ffe940, config=0x555555fc34a0 <stat_config>, _target=0x555555fbee20 <target>, ts=0x0, argc=1, argv=0x7fffffffe490) at util/stat-display.c:1575#16 0x00005555555f27a6 in print_counters (ts=0x0, argc=1, argv=0x7fffffffe490) at builtin-stat.c:1003#17 0x00005555555f71e1 in cmd_stat (argc=1, argv=0x7fffffffe490) at builtin-stat.c:2864#18 0x00005555556cedba in run_builtin (p=0x555555fc5cb0 <commands+336>, argc=2, argv=0x7fffffffe490) at perf.c:349#19 0x00005555556cf050 in handle_internal_command (argc=2, argv=0x7fffffffe490) at perf.c:402#20 0x00005555556cf1ae in run_argv (argcp=0x7fffffffe2ac, argv=0x7fffffffe2a0) at perf.c:446#21 0x00005555556cf4f4 in main (argc=2, argv=0x7fffffffe490) at perf.c:562观察调用栈,比较关键的函数应该是print_instructions ,也就是栈帧10,使用frame命令切过去。然后l命令观察源代码:
(gdb) frame 10#10 0x00005555557a0680 in print_instructions (config=0x555555fc34a0 <stat_config>, evsel=0x55555600bdc0, aggr_idx=0, instructions=453659477297, out=0x7fffffffbda0) at util/stat-shadow.c:322322 print_metric(config, ctxp, NULL, "%7.2f ", "insn per cycle",(gdb) l317 double cycles = find_stat(evsel, aggr_idx, STAT_CYCLES);318 double max_stalled = max(find_stat(evsel, aggr_idx, STAT_STALLED_CYCLES_FRONT),319 find_stat(evsel, aggr_idx, STAT_STALLED_CYCLES_BACK));320321 if (cycles) {322 print_metric(config, ctxp, NULL, "%7.2f ", "insn per cycle",323 instructions / cycles);324 } else325 print_metric(config, ctxp, NULL, NULL, "insn per cycle", 0);326看起来,就是这里在计算IPC,也就是做关键的除法运算。但是与BUG关系密切的时钟数变量cycles是来自另一个函数find_stat。
深度追查
对find_stat设置断点,再次运行perf。
(gdb) bt#0 find_stat (evsel=0x55555600bdc0, aggr_idx=0, type=STAT_CYCLES) at util/stat-shadow.c:189#1 0x00005555557a05c6 in print_instructions (config=0x555555fc34a0 <stat_config>, evsel=0x55555600bdc0, aggr_idx=0, instructions=452444193279, out=0x7fffffffbda0) at util/stat-shadow.c:317#2 0x00005555557a1684 in perf_stat__print_shadow_stats (config=0x555555fc34a0 <stat_config>, evsel=0x55555600bdc0, avg=452444193279, aggr_idx=0, out=0x7fffffffbda0, metric_events=0x555555fc35c0 <stat_config+288>) at util/stat-shadow.c:678#3 0x00005555557a484a in printout (config=0x555555fc34a0 <stat_config>, os=0x7fffffffbf30, uval=452444193279, run=52874278842, ena=88042102280, noise=452444193279, aggr_idx=0) at util/stat-display.c:846#4 0x00005555557a501d in print_counter_aggrdata (config=0x555555fc34a0 <stat_config>, counter=0x55555600bdc0, aggr_idx=0, os=0x7fffffffbf30) at util/stat-display.c:1000#5 0x00005555557a5569 in print_counter (config=0x555555fc34a0 <stat_config>, counter=0x55555600bdc0, os=0x7fffffffbf30) at util/stat-display.c:1110#6 0x00005555557a6fc8 in evlist__print_counters (evlist=0x555555ffe940, config=0x555555fc34a0 <stat_config>, _target=0x555555fbee20 <target>, ts=0x0, argc=1, argv=0x7fffffffe490) at util/stat-display.c:1575#7 0x00005555555f27a6 in print_counters (ts=0x0, argc=1, argv=0x7fffffffe490) at builtin-stat.c:1003#8 0x00005555555f71e1 in cmd_stat (argc=1, argv=0x7fffffffe490) at builtin-stat.c:2864#9 0x00005555556cedba in run_builtin (p=0x555555fc5cb0 <commands+336>, argc=2, argv=0x7fffffffe490) at perf.c:349#10 0x00005555556cf050 in handle_internal_command (argc=2, argv=0x7fffffffe490) at perf.c:402#11 0x00005555556cf1ae in run_argv (argcp=0x7fffffffe2ac, argv=0x7fffffffe2a0) at perf.c:446#12 0x00005555556cf4f4 in main (argc=2, argv=0x7fffffffe490) at perf.c:562断点命中后,仔细观察代表选中事件的evsel指针:
(gdb) p *evsel$13 = {core = {node = {next = 0x55555600c080, prev = 0x55555600bb00}, attr = {type = 0, size = 136, config = 17179869185, { sample_period = 0, sample_freq = 0}, sample_type = 65536, read_format = 3, disabled = 1, inherit = 1, pinned = 0, exclusive = 0, exclude_user = 0, exclude_kernel = 0, exclude_hv = 0, exclude_idle = 0, mmap = 0, comm = 0, freq = 0, inherit_stat = 0, enable_on_exec = 1, task = 0, watermark = 0, precise_ip = 0, mmap_data = 0, sample_id_all = 0, exclude_host = 0, exclude_guest = 1, exclude_callchain_kernel = 0, exclude_callchain_user = 0, mmap2 = 0, comm_exec = 0, use_clockid = 0, context_switch = 0, write_backward = 0, namespaces = 0, ksymbol = 0, bpf_event = 0, aux_output = 0, cgroup = 0, text_poke = 0, build_id = 0, inherit_thread = 0, remove_on_exec = 0, sigtrap = 0, __reserved_1 = 0, { wakeup_events = 0, wakeup_watermark = 0}, bp_type = 0, {bp_addr = 0, kprobe_func = 0, uprobe_path = 0, config1 = 0}, { bp_len = 0, kprobe_addr = 0, probe_offset = 0, config2 = 0}, branch_sample_type = 0, sample_regs_user = 0, sample_stack_user = 0, clockid = 0, sample_regs_intr = 0, aux_watermark = 0, sample_max_stack = 0, __reserved_2 = 0, aux_sample_size = 0, __reserved_3 = 0, sig_data = 0, config3 = 0}, cpus = 0x55555600cb80, own_cpus = 0x55555600a5c0, threads = 0x55555600f5b0, fd = 0x0, mmap = 0x0, sample_id = 0x0, id = 0x0, ids = 0, leader = 0x55555600bdc0, nr_members = 0, system_wide = false, requires_cpu = false, is_pmu_core = false, idx = 7}, evlist = 0x555555ffe940, id_offset = 0, id_pos = -1, is_pos = -1, sample_size = 0, {name = 0x55555600e310 "cpu_core/instructions/", group_name = 0x0, pmu_name = 0x55555600c060 "cpu_core", group_pmu_name = 0x0, tp_format = 0x0, filter = 0x0, max_events = 18446744073709551615, scale = 1, unit = 0x55555600c040 "", cgrp = 0x0, metric_id = 0x0, tool_event = PERF_TOOL_NONE, exclude_GH = 0, sample_read = 0, snapshot = false, per_pkg = false, percore = false, precise_max = false, is_libpfm_event = false, auto_merge_stats = false, collect_stat = false, weak_group = false, bpf_counter = false, use_config_name = false, skippable = false, bpf_fd = -1, bpf_obj = 0x0, config_terms = { next = 0x55555600bf50, prev = 0x55555600bf50}}, metric_events = 0x0, metric_leader = 0x0, handler = 0x0, counts = 0x55555600d520, prev_raw_counts = 0x0, nr_events_printed = 0, stats = 0x55555600d490, priv = 0x0, db_id = 0, uniquified_name = false, supported = true, needs_swap = false, disabled = false, no_aux_samples = false, immediate = false, tracking = false, ignore_missing_thread = false, forced_leader = false, cmdline_group_boundary = false, merged_stat = false, reset_group = false, errored = false, needs_auxtrace_mmap = false, default_metricgroup = false, per_pkg_mask = 0x0, err = 0, side_band = {cb = 0x0, data = 0x0}, synth_sample_type = 0, bpf_counter_ops = 0x0, bpf_counter_list = {next = 0x55555600bfe8, prev = 0x55555600bfe8}, bpf_filters = {next = 0x55555600bff8, prev = 0x55555600bff8}, bperf_leader_prog_fd = 0, bperf_leader_link_fd = 0, {leader_skel = 0x0, follower_skel = 0x0, bpf_skel = 0x0}, open_flags = 8, precise_ip_original = 0, pmu = 0x0}从pmu_name的值为"cpu_core"来看,它是关于大核的。
再看搜索返回时的cur指针,它的值是"cpu_atom",是关于小核的:
(gdb) p cur->pmu_name$22 = 0x55555600b820 "cpu_atom"(gdb) p evsel->name$23 = 0x55555600e310 "cpu_core/instructions/"看了这个搜索函数返回了错误的数据。
匹配逻辑
find_stat函数不算长,完整代码如下:
static double find_stat(const struct evsel *evsel, int aggr_idx, enum stat_type type){        const struct evsel *cur;        int evsel_ctx = evsel_context(evsel);
        evlist__for_each_entry(evsel->evlist, cur) {                struct perf_stat_aggr *aggr;
                /* Ignore the evsel that is being searched from. */                if (evsel == cur)                        continue;
                /* Ignore evsels that are part of different groups. */                if (evsel->core.leader->nr_members > 1 &&                    evsel->core.leader != cur->core.leader)                        continue;                /* Ignore evsels with mismatched modifiers. */                if (evsel_ctx != evsel_context(cur))                        continue;                /* Ignore if not the cgroup we're looking for. */                if (evsel->cgrp != cur->cgrp)                        continue;                /* Ignore if not the stat we're looking for. */                if (type != evsel__stat_type(cur))                        continue;
                /*                 * Except the SW CLOCK events,                 * ignore if not the PMU we're looking for.                 */                if ((type != STAT_NSECS) && (evsel->pmu != cur->pmu) )                        continue;
                aggr = &cur->stats->aggr[aggr_idx];                if (type == STAT_NSECS)                        return aggr->counts.val;                return aggr->counts.val * cur->scale;        }        return 0.0;}
函数中遍历事件列表,搜索指定类型的事件。中间加了一些判断排除不合适的事件。
临时修改
把find_stat中的循环跟踪几圈后,我知道BUG的原因了。下面这个判断失灵,没能把不属于同一个PMU的事件排除掉。
if ((type != STAT_NSECS) && (evsel->pmu != cur->pmu) ) continue;pmu字段是个指针,在调试器里观察,它总是NULL,不论是evsel的pmu指针,还是小核事件的pmu指针,都是NULL,两个NULL相等,判断失灵,导致张冠李戴。
跟踪时,我发现事件的pmu_name属性不为空,而且大核的叫cpu_core,小核的叫cpu_atom。于是大胆的做了个临时修改:
if ((type != STAT_NSECS) && strcmp(evsel->pmu_name, cur->pmu_name) != 0 ) continue;再编译运行,BUG不见了:
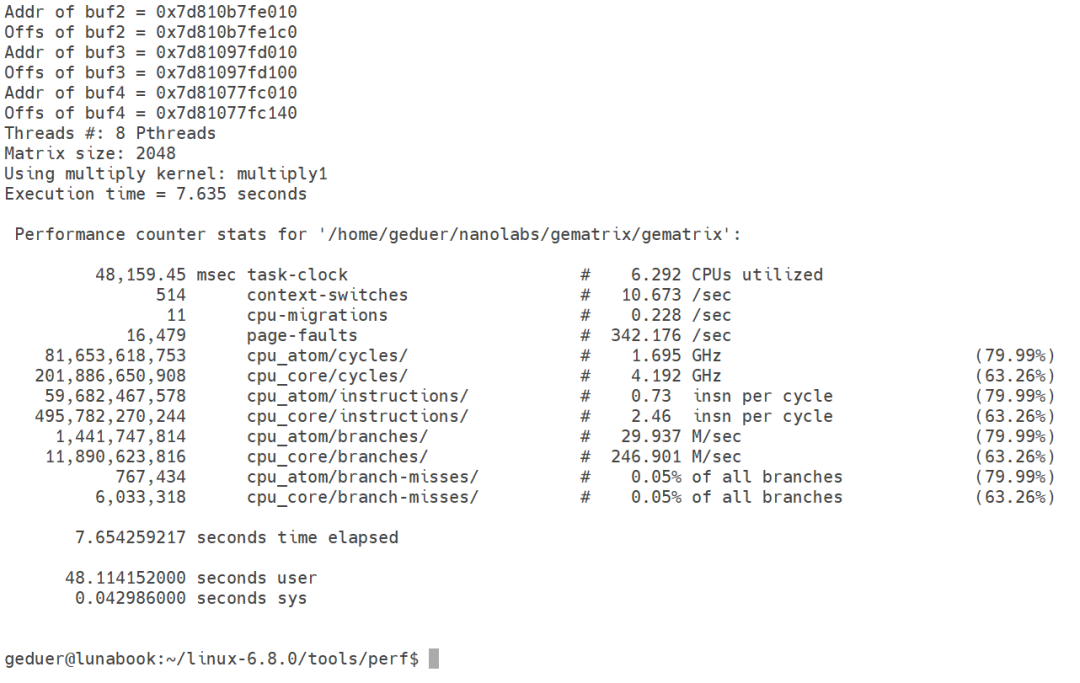
对于大矩阵乘法的1号算法,大核的IPC为2.46,小核的IPC为0.73,大核的表现优于小核。
回过头来看,这个表面上非常明显的BUG,实际上还是有些复杂的,不是简单的单点错误,而是牵涉到多个函数。对于这样的BUG,不上调试器的话,是不太容易看出来的。这再次证明了调试技术的重要性,应格友们的提议,《全栈调试实战营之二线拍案惊奇》正在招募中,希望深耕调试技术的小伙伴请点击链接查看详情。

(写文章很辛苦,恳请各位读者点击“在看”,欢迎转发)
*************************************************
正心诚意,格物致知,以人文情怀审视软件,以软件技术改变人生
扫描下方二维码或者在微信中搜索“盛格塾”小程序,可以阅读更多文章和有声读物

也欢迎关注格友公众号


 5036
5036

 被折叠的 条评论
为什么被折叠?
被折叠的 条评论
为什么被折叠?
 到【灌水乐园】发言


