


 本文汇集了多篇IEEE杂志论文中的图表,探讨物联网、边缘计算和5G网络中的深度学习应用。通过分析图表,揭示了在物联网设备上的视频识别、区块链在电动车中的安全应用、5G超密集网络的资源分配技术、AI在网络流量管理中的作用,以及移动边缘计算与深度学习的结合等前沿话题。
学术论文中简洁优美的图表可以为论文的整体呈现增色不少,而如何设计图表是一门学问。
计划每周浏览10篇Magzine论文中的图表,学习一些画图技巧。
【1】Learning IoT in Edge: Deep Learning for the Internet of Things with Edge Computing

Figure 1. Deep learning for video recognition with IoT devices.

Figure 2. Edge computing structure for IoT deep learning.

【2】Blockchain-Enabled Security in Electric Vehicles Cloud and Edge Computing

1 The network architecture of EVCE computing.

The contexts-aware vehicular applications based on the information and energy interactions.

The structure of distributed consortium blockchain.

The security scheme in EV cloud computing.

The security scheme in the EV edge computing
【3】A Deep-Learning-Based Radio Resource Assignment Technique for 5G Ultra Dense Networks
Figure 1.

Considered 5G network scenario.
Figure 2.

The enabling technologies of 5G and how deep learning may play an effective role in 5G radio resource control.
Figure 3.
View in Context View Full Size Image

Considered LSTM structure.
Figure 4.

The proposed LSTM-based radio resource control algorithm for the considered 5G UDN.
Figure 5.

【4】Artificial Intelligence to Manage Network Traffic of 5G Wireless Networks
Figure 1.

New 5G network architecture.
Figure 2.

a) Supervised learning; b) Unsupervised learning.
Figure 3.

Deep reinforcement leaning in the context of network traffic control.
Figure 4.

Distributed and lightweight ML algorithms in 5G.
Figure 5.

AI assistant content retrieval algorithm framework.
【5】Robust Mobile Crowd Sensing: When Deep Learning Meets Edge Computing
Figure 1.

The RMCS architectrue.
Figure 2.

The proposed deep learning based data validation and the edge-computing based implementation.
Figure 3.

Smart transportation system.
Figure 4.

Scheme of deep learning based image data validation.
【6】When big data meets software-defined networking: SDN for big data and big data for SDN
Figure 1.

Good features of SDN that can benefit big data applications.
Figure 2.

Dynamic traffic engineering system architecture with SDN and big data.
Figure 3.

Cross-layer design with SDN and big data.
Figure 4.

Potential attacks can be launched on the three layers of SDN.
Figure 5.

SDN-based intra- and inter-data-center networks with big data.
【7】Selective Offloading in Mobile Edge Computing for the Green Internet of Things
Figure 1.

The three-layer integration architecture of the cloud, MEC, and IoT.
Figure 2.

Scalability problem and selective offloading.
Figure 3.

The proposed request and admission framework.
Figure 4.

Flow diagram of our proposed selective offloading scheme.
Figure 5.

Comparison of average latency. Selective offloading approaches to the latency requirements.
Figure 6.

Comparison of average energy consumption. The trade-off between latency and energy consumption is inherent.
【8】Toward Low-Latency and Ultra-Reliable Virtual Reality
Figure 1.

Single- and multiple-user VR use cases: Requirements and enablers.
Figure 2
View in Context View Full Size Image

Interactive VR gaming arcade with mmWave APs and edge computing network architecture.
Figure 3

Average delay and 99th percentile communication delay performance as the number of players varies, with 4 mmAPs and 8 MEC servers. The 99 percent confidence level margin of error is0.01088≤ME≤0.0208 ms for all configurations above.
Figure 4

Figure 5.

【9】Consolidate IoT Edge Computing with Lightweight Virtualization
Figure 1.

A subset of use cases and services enabled by IoT edge computing.
Figure 2.

LV techniques comparison: a) Quantitative analysis; b) Core architectural differences.
Figure 3.

a) Vehicular edge computing scenario in its entirety, vehicular-to-edge (V2E) interactions examples; b) Car-to-car V2E communication; c) Base station-to-car V2E communication; d) Container-based virtualization is used for easier OBU customization. Furthermore, within the same vehicle orchestration tools are exploited for task offloading among different OBUs.
Figure 4.

Air pollution scenario. An offloadable task is air quality index (AQI) calculation, a number used by government agencies to communicate to the public how polluted the air currently is or how polluted it is forecast to become. Calculation of the AQI can be executed locally by edge nodes enhancing realtime monitoring.
Figure 5.

a) A biker receiving personalized advertisements rendered in augmented reality on his/her smart glasses; b) A smart car populating its augmented windshield with contextualized, live feed information; c) An augmented smart home, where we control IoT devices in proximity through virtual interfaces.
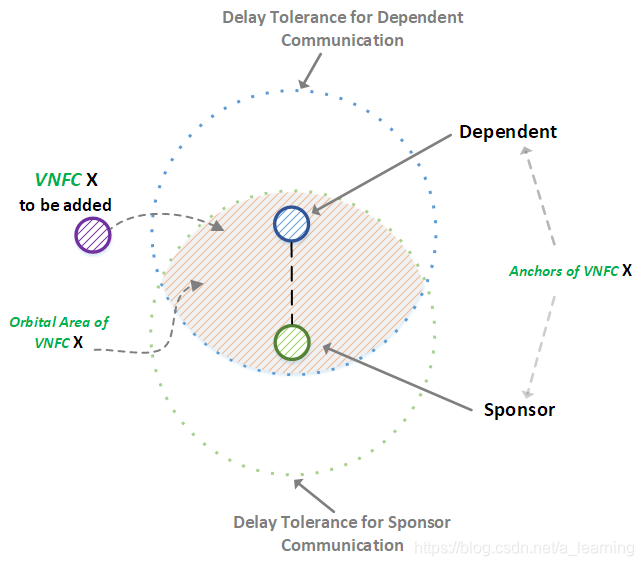
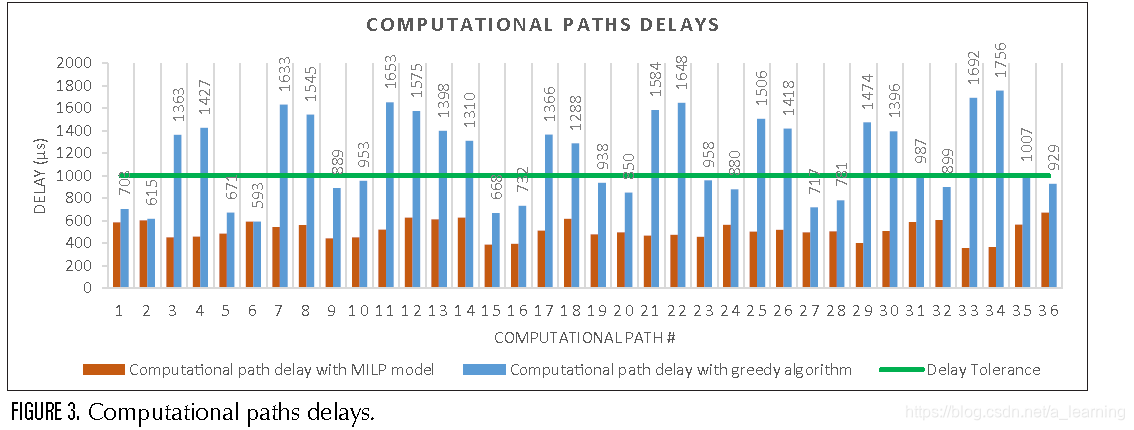
【10】Exploring Microservices as the Architecture of Choice for Network Function Virtualization Platforms


 4398
4398

 被折叠的 条评论
为什么被折叠?
被折叠的 条评论
为什么被折叠?
 到【灌水乐园】发言


