


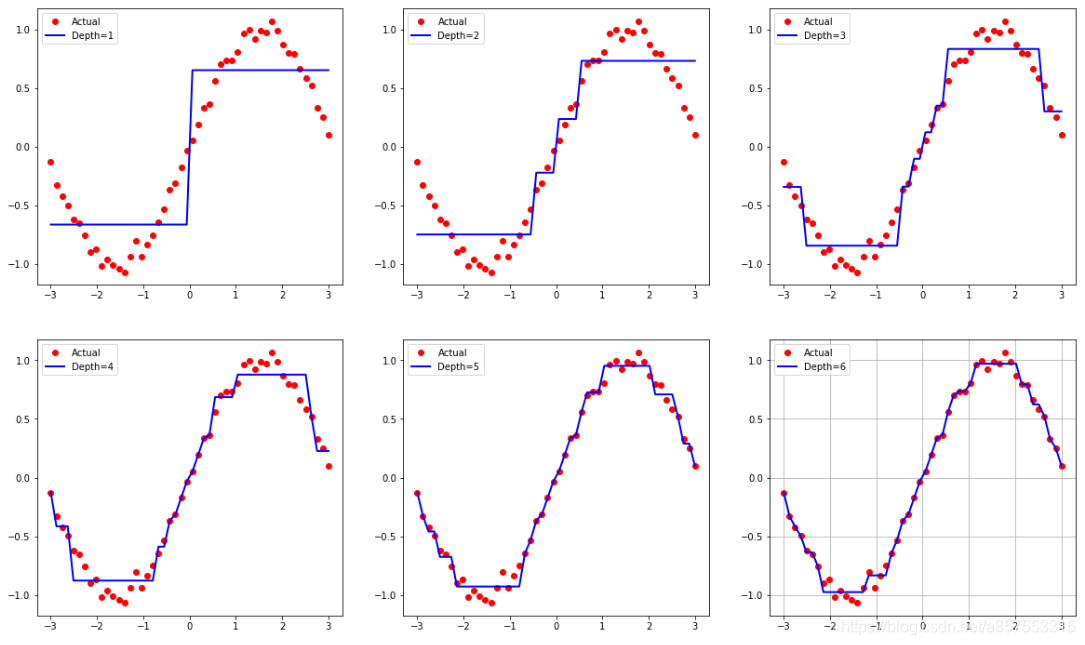
 本文通过使用决策树回归模型,探讨了不同深度设置下模型预测性能的变化。通过对正弦波数据集进行拟合,展示了随着决策树深度增加,模型复杂度及过拟合风险的变化趋势。
import numpy as np
import matplotlib.pyplot as plt
from sklearn.tree import DecisionTreeRegressor

if __name__ == "__main__":
    N = 50
    x = np.linspace(-3, 3, N)
    y = np.sin(x) + np.random.randn(N) * 0.05
#     print(x.shape, x) #  (50,) [-3.         -2.87755102 -2.75510204 ...]
    x = x.reshape(-1, 1)  # 转置后,得到N个样本,每个样本都是1维的
#     print(x.shape, x) # (50, 1) [[-3.        ] [-2.87755102]  [-2.75510204] ...]

    # 比较决策树的深度影响
    depth = [1, 2, 3, 4, 5, 6]
    dtr = DecisionTreeRegressor(criterion='mse')
    x_test = np.linspace(-3, 3, 50).reshape(-1, 1)
    plt.figure(figsize=(20, 12))
    for i,d in enumerate(depth):
        ax = plt.subplot(2,3,i+1)
        ax.plot(x, y, 'ro', ms=6, label='Actual')
        dtr.set_params(max_depth=d)
        dtr.fit(x, y)
        y_hat = dtr.predict(x_test)
        ax.plot(x_test, y_hat, '-', color='b', linewidth=2, label='Depth=%d' % d)
        ax.legend()
    plt.legend(loc='upper left')
    plt.grid(b=True)
    plt.show()
深度不同的结果如下:


 1434
1434

 被折叠的 条评论
为什么被折叠?
被折叠的 条评论
为什么被折叠?
 到【灌水乐园】发言


