


一.热力图和子图的绘制
1.绘制热力图
import pandas as pd # 读取数据
import seaborn as sns
import matplotlib.pyplot as plt
data = pd.read_csv('heart.csv')
data.info() # 查看数据
continuous_features = data.select_dtypes(include = ['int64','float64']).columns.tolist()
print(continuous_features)
# 计算相关系数矩阵
correlation_matrix = data[continuous_features].corr()
# 设置图片清晰度
plt.rcParams['figure.dpi'] = 100
# 绘制热力图
plt.figure(figsize=(12, 10))
sns.heatmap(correlation_matrix, annot=True, cmap='coolwarm', vmin=-1, vmax=1)
plt.title('Correlation Heatmap of Continuous Features')
plt.show()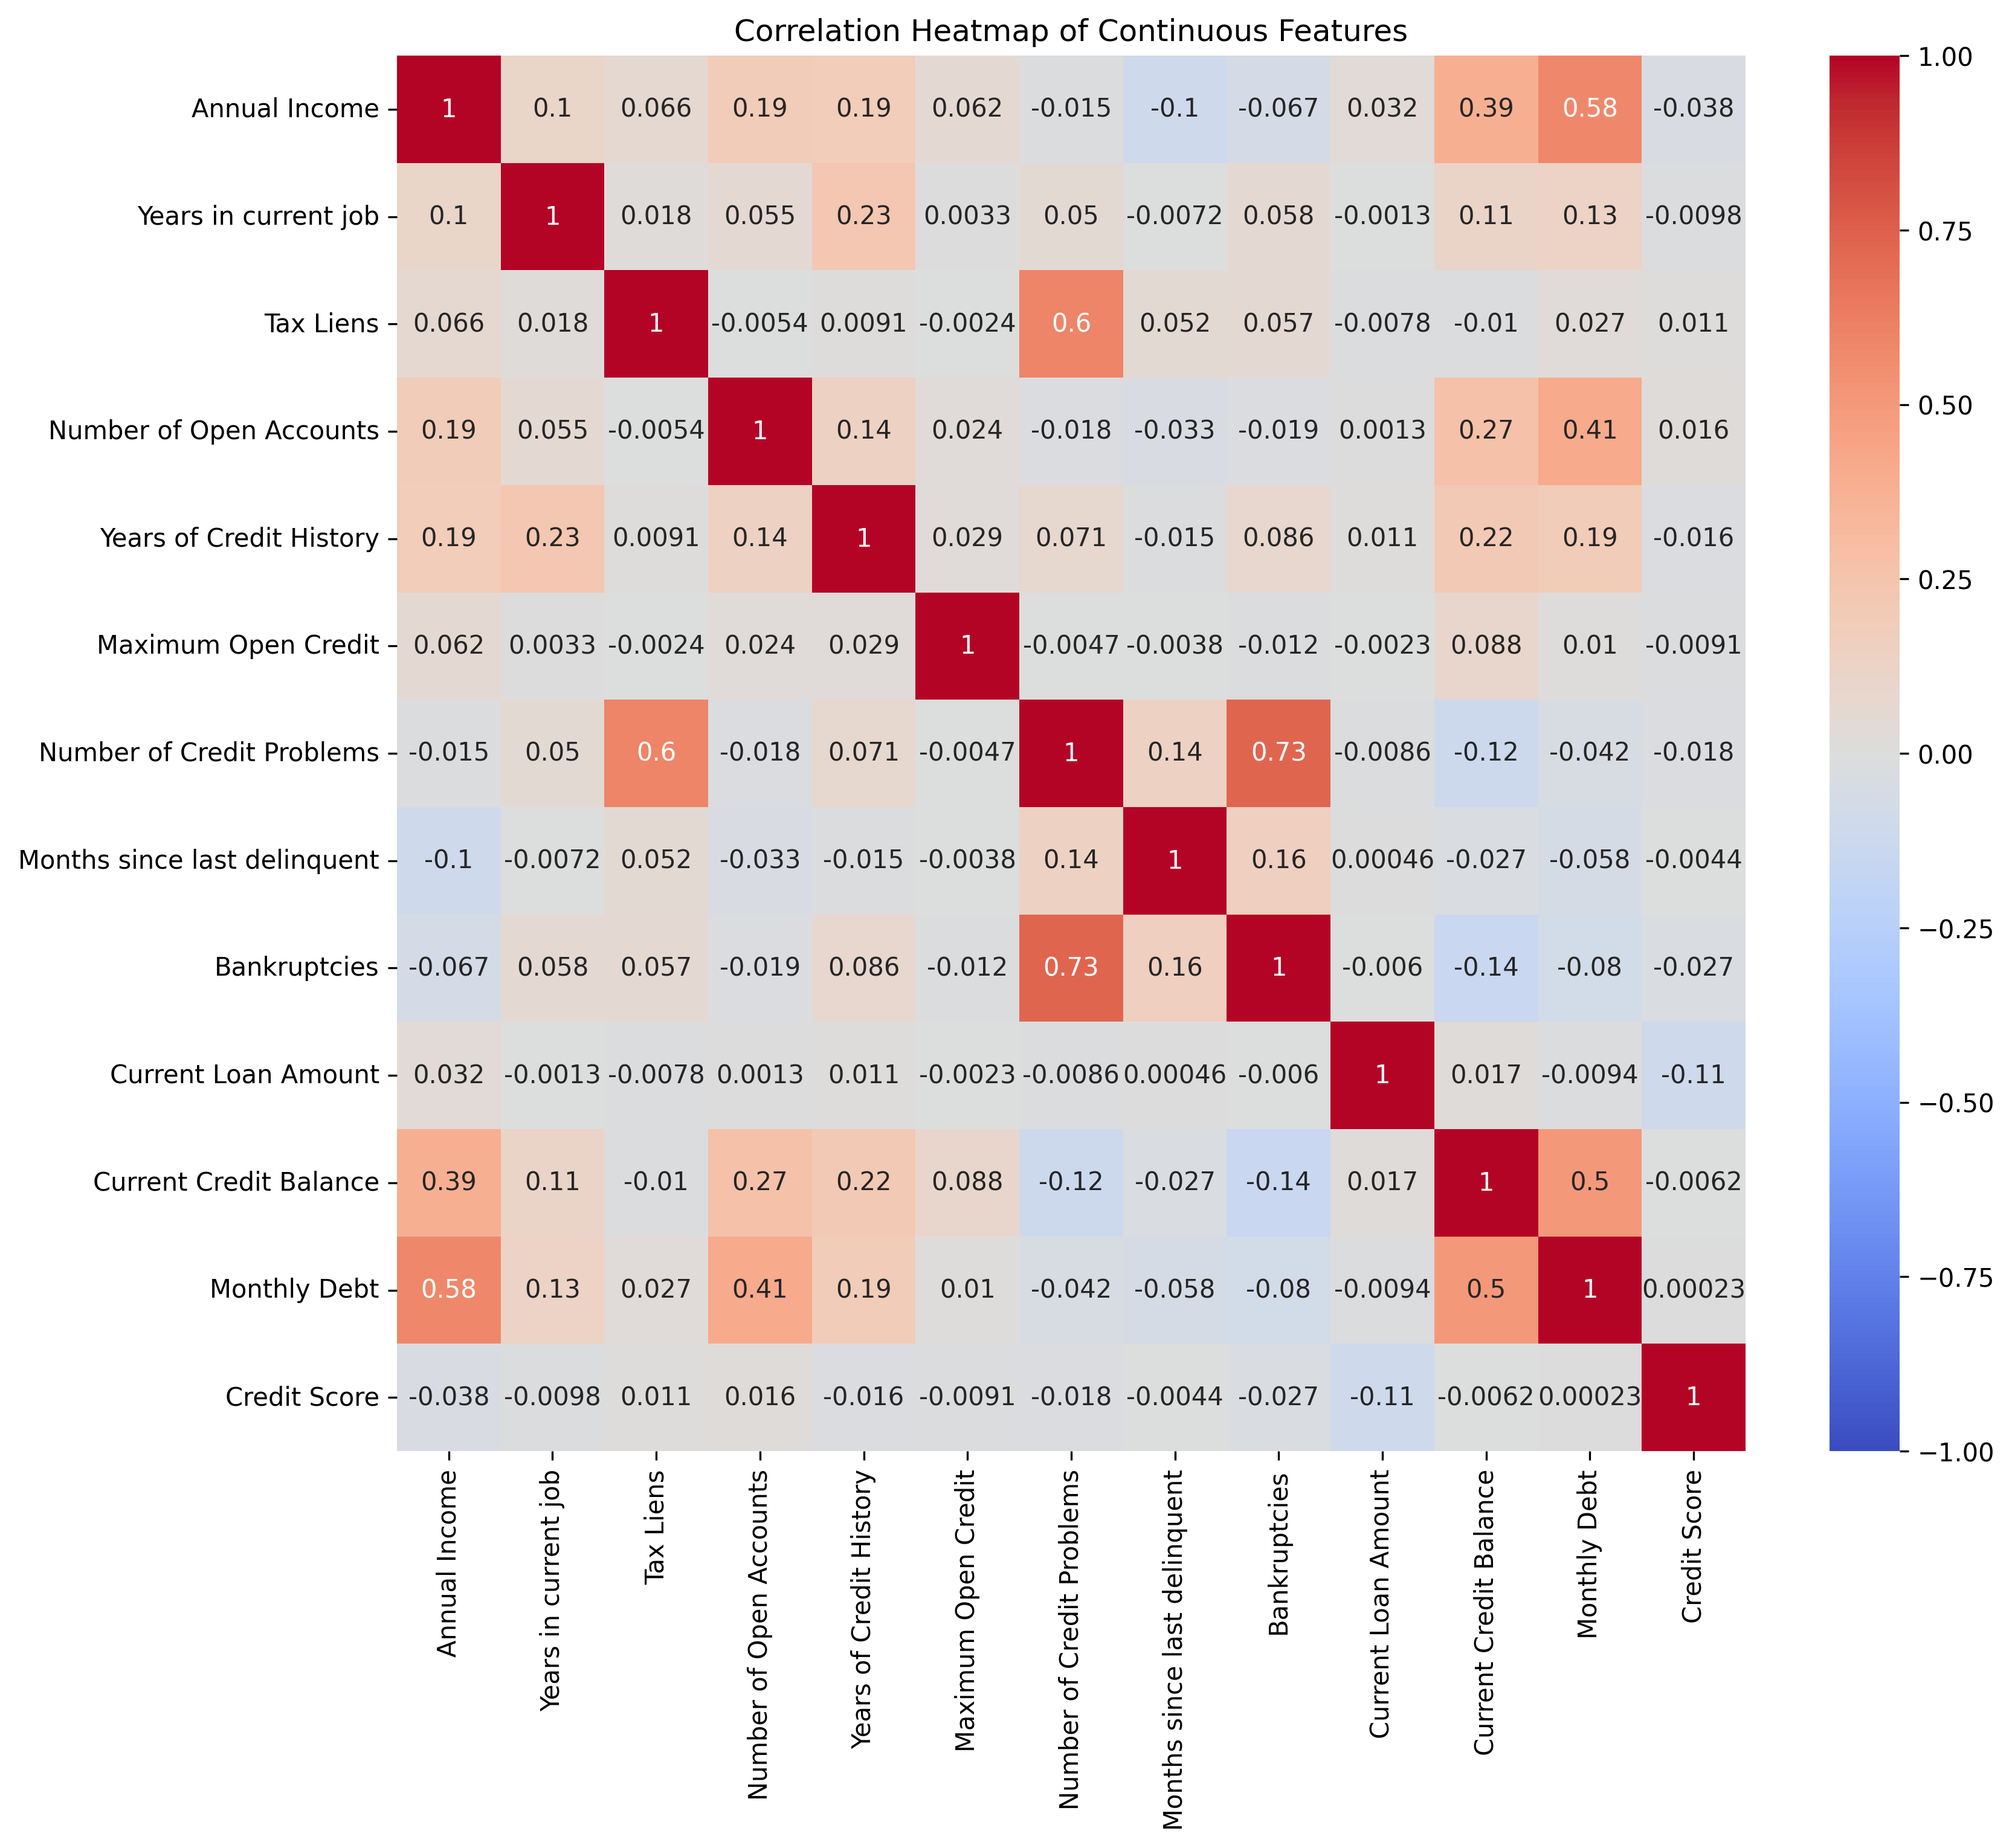 热力图本质上只能对连续值进行绘制,对于数值形的离散值其实是不合适用热力图的
2.绘制子图
import pandas as pd
import matplotlib.pyplot as plt


# 定义要绘制的特征
features = ['Annual Income', 'Years in current job', 'Tax Liens', 'Number of Open Accounts']
# 随便选的4个特征,不要在意对不对

# 设置图片清晰度
plt.rcParams['figure.dpi'] = 300

# 创建一个包含 2 行 2 列的子图布局
fig, axes = plt.subplots(2, 2, figsize=(12, 8))

# 手动指定特征索引进行绘图,仔细观察下这个坐标
i = 0
feature = features[i]
axes[0, 0].boxplot(data[feature].dropna())
axes[0, 0].set_title(f'Boxplot of {feature}')
axes[0, 0].set_ylabel(feature)

i = 1
feature = features[i]
axes[0, 1].boxplot(data[feature].dropna())
axes[0, 1].set_title(f'Boxplot of {feature}')
axes[0, 1].set_ylabel(feature)

i = 2
feature = features[i]
axes[1, 0].boxplot(data[feature].dropna())
axes[1, 0].set_title(f'Boxplot of {feature}')
axes[1, 0].set_ylabel(feature)

i = 3
feature = features[i]
axes[1, 1].boxplot(data[feature].dropna())
axes[1, 1].set_title(f'Boxplot of {feature}')
axes[1, 1].set_ylabel(feature)

# 调整子图之间的间距
plt.tight_layout()

# 显示图形
plt.show()
借助循环实现
# 定义要绘制的特征
features = ['Annual Income', 'Years in current job', 'Tax Liens', 'Number of Open Accounts']

# 设置图片清晰度
plt.rcParams['figure.dpi'] = 300

# 创建一个包含 2 行 2 列的子图布局
fig, axes = plt.subplots(2, 2, figsize=(12, 8))

# 使用 for 循环遍历特征
for i in range(len(features)):
    row = i // 2 # 计算当前特征在子图中的行索引,// 是整除,即取整 ,之所以用整除是因为我们要的是行数
    # 例如 0//2=0, 1//2=0, 2//2=1, 3//2=1
    col = i % 2 # 计算当前特征在子图中的列索引,% 是取余,即取模
    # 例如 0%2=0, 1%2=1, 2%2=0, 3%2=1
    # 绘制箱线图
    feature = features[i]
    axes[row, col].boxplot(data[feature].dropna())
    axes[row, col].set_title(f'Boxplot of {feature}')
    axes[row, col].set_ylabel(feature)

# 调整子图之间的间距
plt.tight_layout()

# 显示图形
plt.show()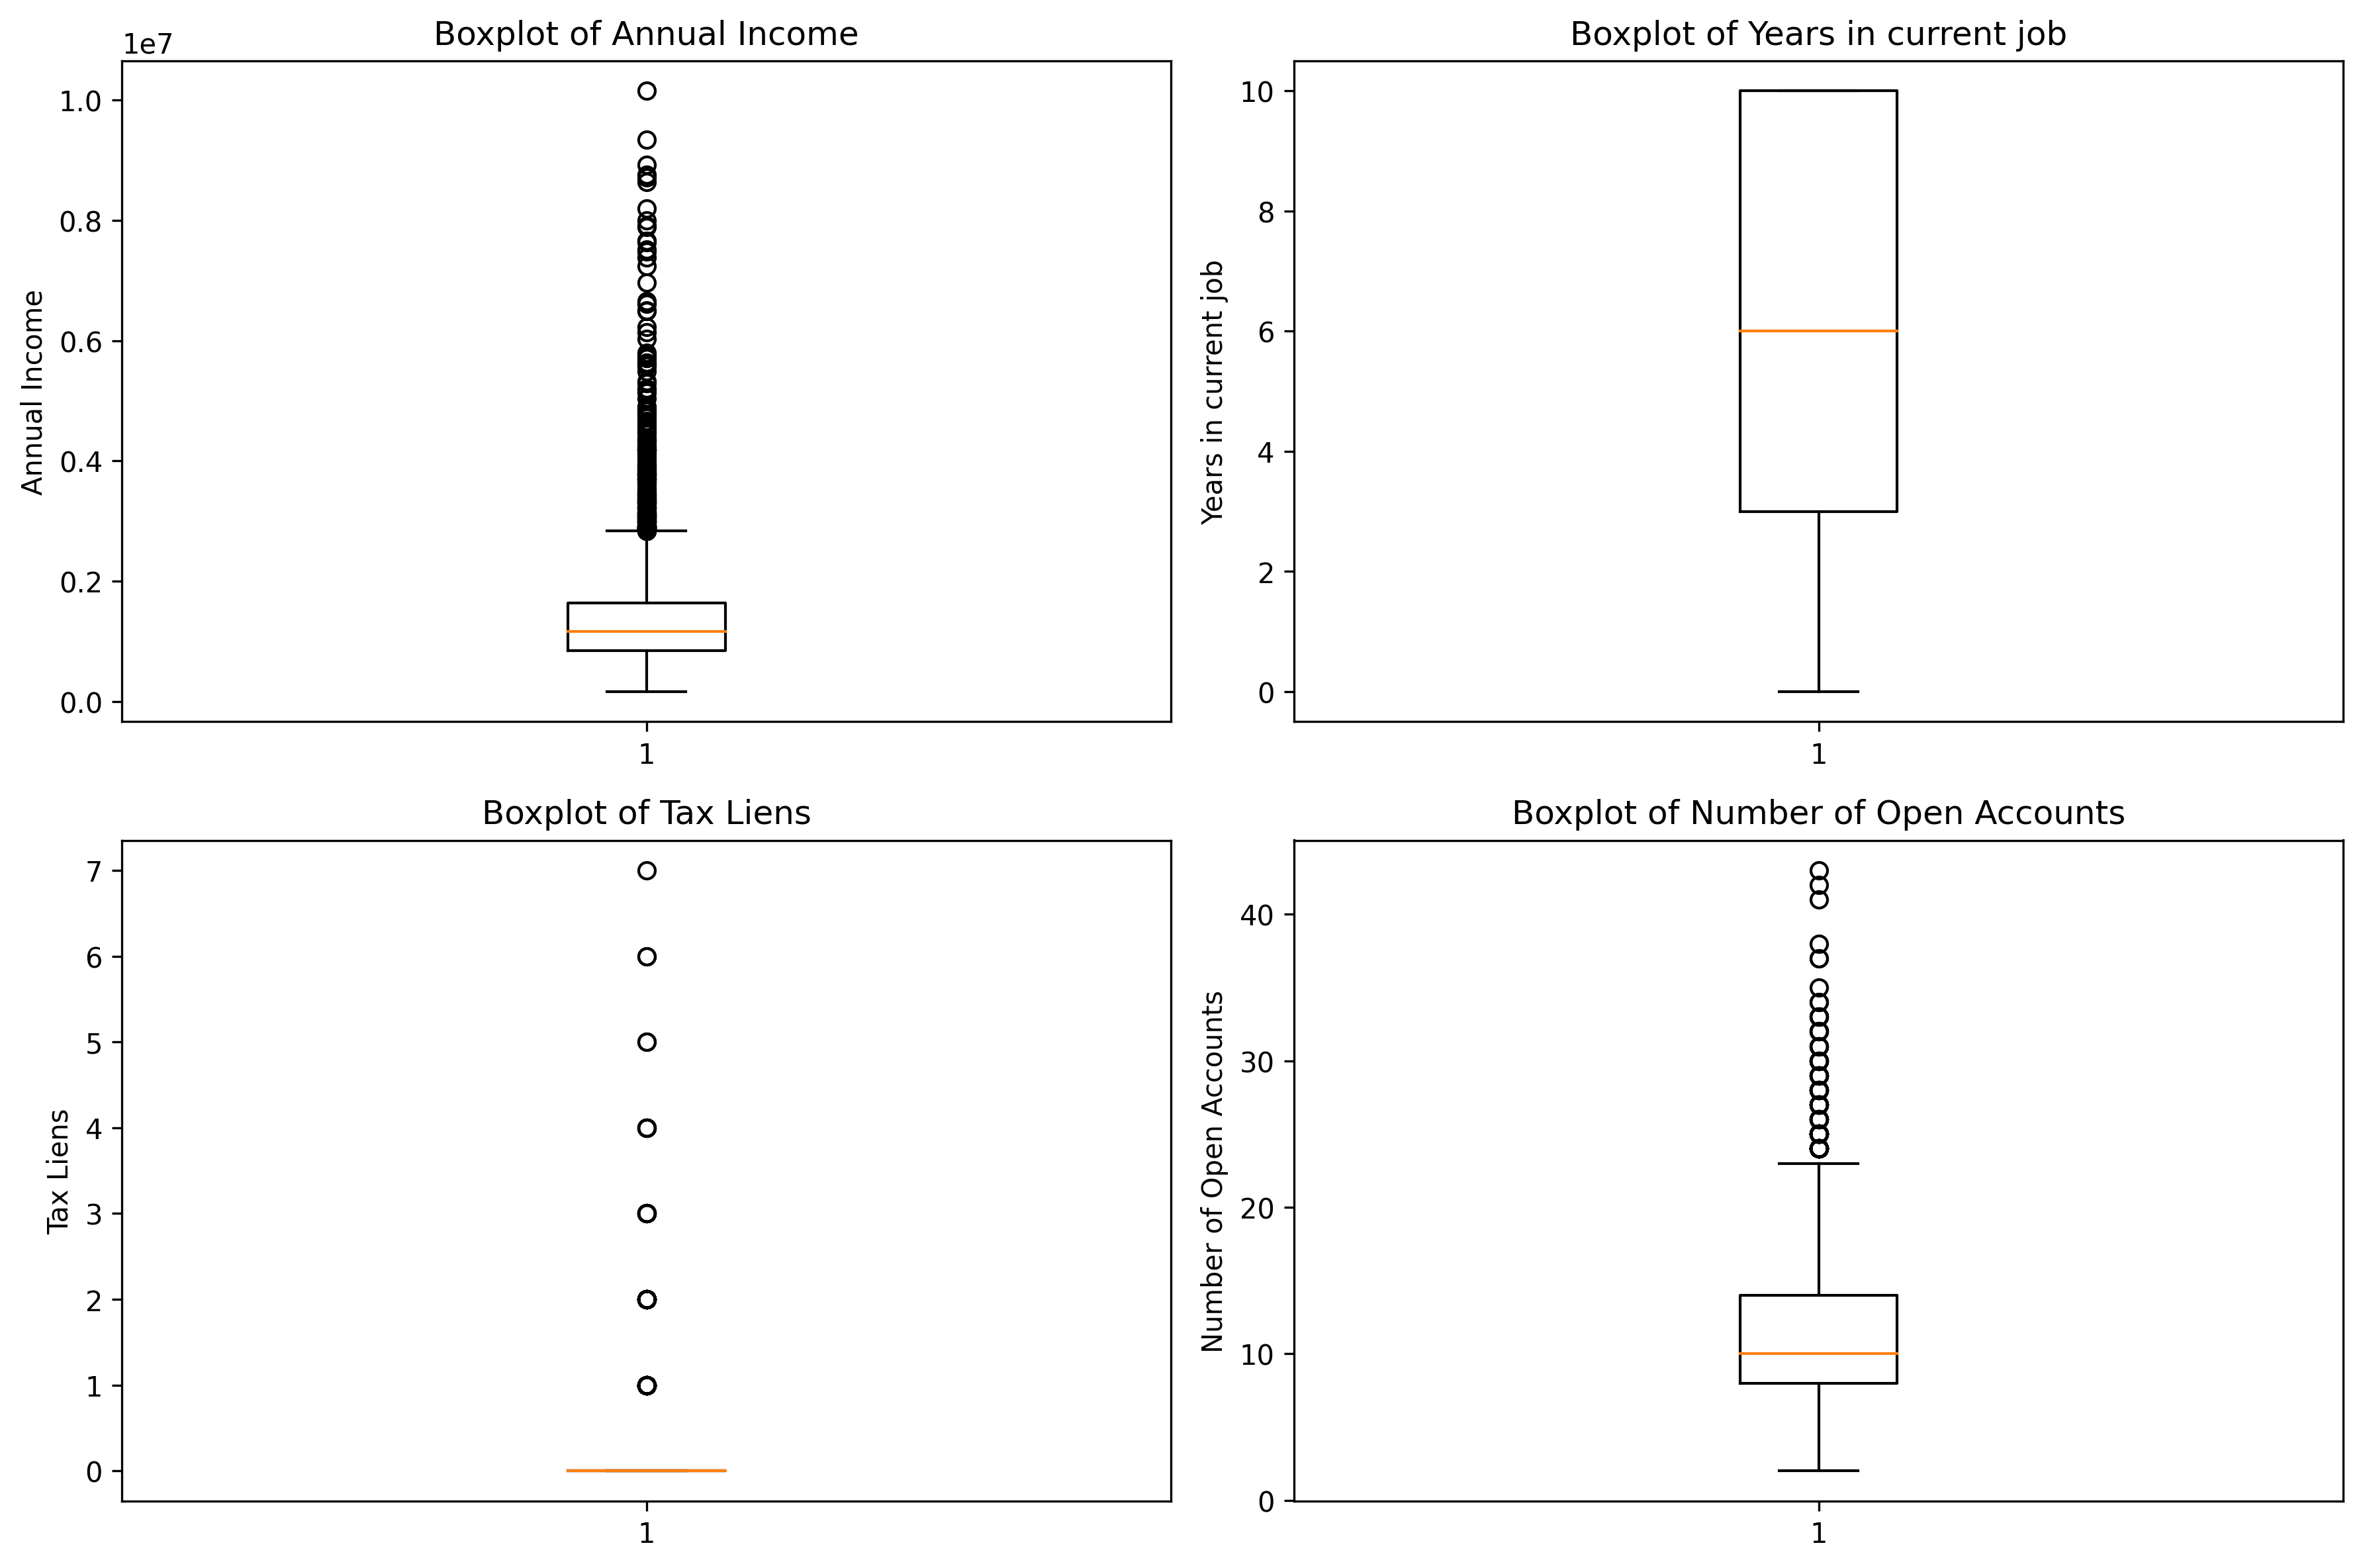
二.enumerate()函数:
enumerate()函数返回一个迭代对象,该对象包含索引和值。
语法:
enumerate(iterable, start=0)
参数:
iterable -- 迭代对象,迭代对象可以是列表、元组、字典、字符串等。
start -- 索引的开始值
返回值:
返回一个迭代对象,该对象包含索引和值。
之所以这个函数很有用,是因为它允许我们同时迭代一个序列,并获取每个元素的索引和值。
# 定义要绘制的特征
features = ['Annual Income', 'Years in current job', 'Tax Liens', 'Number of Open Accounts']

# 设置图片清晰度
plt.rcParams['figure.dpi'] = 300

# 创建一个包含 2 行 2 列的子图布局,其中
fig, axes = plt.subplots(2, 2, figsize=(12, 8))#返回一个Figure对象和Axes对象
# 这里的axes是一个二维数组,包含2行2列的子图
# 这里的fig是一个Figure对象,表示整个图形窗口
# 你可以把fig想象成一个画布,axes就是在这个画布上画的图形

# 遍历特征并绘制箱线图
for i, feature in enumerate(features):
    row = i // 2
    col = i % 2
    axes[row, col].boxplot(data[feature].dropna())
    axes[row, col].set_title(f'Boxplot of {feature}')
    axes[row, col].set_ylabel(feature)

# 调整子图之间的间距
plt.tight_layout()

# 显示图形
plt.show()


 590
590

 被折叠的 条评论
为什么被折叠?
被折叠的 条评论
为什么被折叠?
 到【灌水乐园】发言


