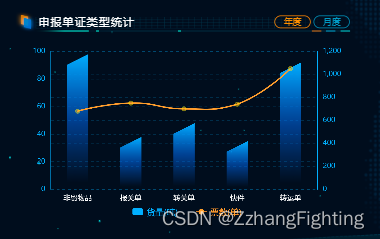
echarts柱状图斜切面图表

<template>
<div ref="chart" style="width: 100%; height: 100%"></div>
</template>
<script>
import echarts from "echarts";
export default {
name: "freightChart",
props: {
chartData: {
type: Object,
default() {
return {
axisData: ["非贸物品", "报关单", "转关单", "快件", "转运单"],
seriesData: [98, 38, 48, 35, 92],
unit: "货班(万班次)",
nameData: [680, 750, 700, 740, 1050],
};
},
},
},
watch: {
chartData: {
deep: true,
handler(val) {
this.setOptions(val);
},
},
},
mounted() {
const myShape = {
x: 0,
y: 0,
width: 50,
};
const InclinedRoofColumn = echarts.graphic.extendShape({
shape: myShape,
buildPath: function (ctx, shape) {
const xAxisPoint = shape.xAxisPoint;
const c0 = [shape.x +15 , shape.y ];
const c1 = [shape.x -15, shape.y +15];
const c2 = [xAxisPoint[0] -15, xAxisPoint[1] ];
const c3 = [xAxisPoint[0] +15, xAxisPoint[1]];
ctx.moveTo(c0[0], c0[1]).lineTo(c1[0], c1[1]).lineTo(c2[0], c2[1]).lineTo(c3[0], c3[1]).closePath();
},
});
echarts.graphic.registerShape('InclinedRoofColumn', InclinedRoofColumn);
this.$nextTick(() => {
this.initChart();
});
},
methods: {
initChart() {
this.chart = echarts.init(this.$refs.chart);
this.setOptions(this.chartData);
},
setOptions({ axisData, seriesData, nameData } = {}) {
const option = {
tooltip: {
trigger: "axis",
axisPointer: {
type: "none",
},
formatter: function (params) {
return (
axisData[params[0].dataIndex] +
"<br/>货量:" +
seriesData[params[0].dataIndex] +
"吨" +
"<br> 票数:" +
nameData[params[0].dataIndex] +
""
);
},
},
grid: {
top: "10%",
bottom: "10%",
left: "5%",
right: "5%",
containLabel: true,
},
legend: {
data: ["货量(吨)", "票数(单)"],
left: "center",
bottom: "0",
textStyle: {
padding: [4, 0, 0, 0],
color: "33FFFF",
},
itemWidth: 15,
itemHeight: 10,
itemGap: 25,
},
tooltip: {
trigger: "axis",
axisPointer: {
type: "shadow",
},
},
xAxis: [
{
type: "category",
axisTick: {
show: false,
},
interval: 1,
axisLabel: {
color: "#fff",
fontSize: "1rem",
},
axisLine: {
show: false,
},
data: axisData,
},
],
yAxis: [
{
type: "value",
splitNumber: 5,
splitLine: {
show: true,
lineStyle: {
type: "dashed",
color: "rgba(36, 173, 254, 0.2)",
},
},
axisTick: {
show: false,
},
axisLabel: {
textStyle: {
color: "rgba(36, 173, 254, 1)",
},
fontSize: "1rem",
},
axisLine: {
show: true,
lineStyle: {
color: "rgba(36, 173, 254, 1)",
},
},
},
],
series: [
{
name: "货量(吨)",
type: 'custom',
itemStyle: {
normal: {
color: "#29acff",
},
},
renderItem: (params, api) => {
const location = api.coord([api.value(0), api.value(1)]);
return {
type: 'InclinedRoofColumn',
shape: {
api,
xValue: api.value(0),
yValue: api.value(1),
x: location[0],
y: location[1],
xAxisPoint: api.coord([api.value(0), 0]),
},
style: {
fill: new echarts.graphic.LinearGradient(0, 0, 0, 1, [
{
offset: 0,
color: "#29acff",
},
{
offset: 0.5,
color: "rgba(17, 108, 253, 0.5)",
},
{
offset: 0.95,
color: "rgba(17, 108, 253, 0)",
},
]),
},
};
},
data: seriesData,
},
{
name: "票数(单)",
type: "line",
zlevel: 2,
yAxisIndex: 1,
symbol: "circle",
symbolSize: 2,
smooth: true,
itemStyle: {
normal: {
color: "#ffa43a",
borderColor: "rgba(255, 234, 0, 0.5)",
borderWidth: 5,
},
},
lineStyle: {
color: "#ffa43a",
},
data: nameData,
},
],
};
this.chart.setOption(option);
},
},
};
</script>
<style scoped>
</style>


 本文介绍如何使用ECharts创建具有独特斜切效果的柱状图,并结合折线图展示数据对比。通过自定义柱形图的形状,实现美观且直观的数据呈现。


 1110
1110

 被折叠的 条评论
为什么被折叠?


