


———————————————————————————————
函数介绍

MATLAB官网描述:
https://ww2.mathworks.cn/help/matlab/ref/subplot.html?searchHighlight=subplot&s_tid=srchtitle_support_results_1_subplot
二子图
代码主体
clc;clear
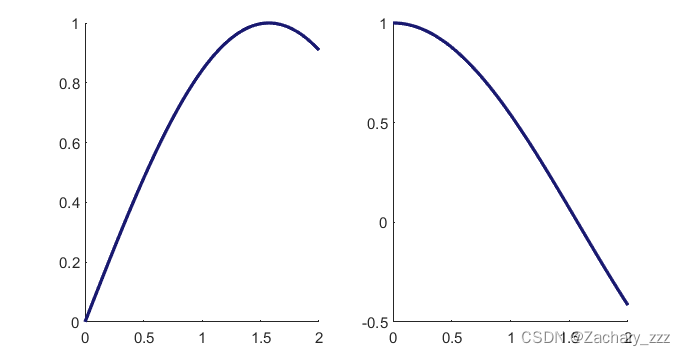
%% 第一个子图窗口
subplot(1,2,1); % 创建
hold on
x1 = linspace(0,2,400);
y1 = sin(x1);
l1 = plot(x1, y1,'Color','#191970','LineWidth',2);
%% 第二个子图窗口
subplot(1,2,2); % 创建
hold on
x2 = linspace(0,2,400);
y2 = cos(x2);
l2 = plot(x2, y2,'Color','#191970','LineWidth',2);
结果演示
———————————————————————————————
三子图
代码主体
%% 第一个子图窗口
subplot(2,2,1); % 创建
hold on
x1 = linspace(0,2
最低0.47元/天 解锁文章


 762
762

 被折叠的 条评论
为什么被折叠?
被折叠的 条评论
为什么被折叠?
 到【灌水乐园】发言


