


目录
1 完整代码
var roi = table;
Map.centerObject(roi, 7);
var styling = {
color: "red",
fillColor: "00000000"
};
Map.addLayer(roi.style(styling), {}, "geometry");
// 选择数据源
var collection = ee.ImageCollection('MODIS/006/MOD13Q1')
.filterBounds(roi)
.filterDate('2020-01-01', '2020-12-31') // 筛选日期
.select('NDVI')
.map(function(image) {
return image.multiply(0.0001)
.copyProperties(image, image.propertyNames());
});
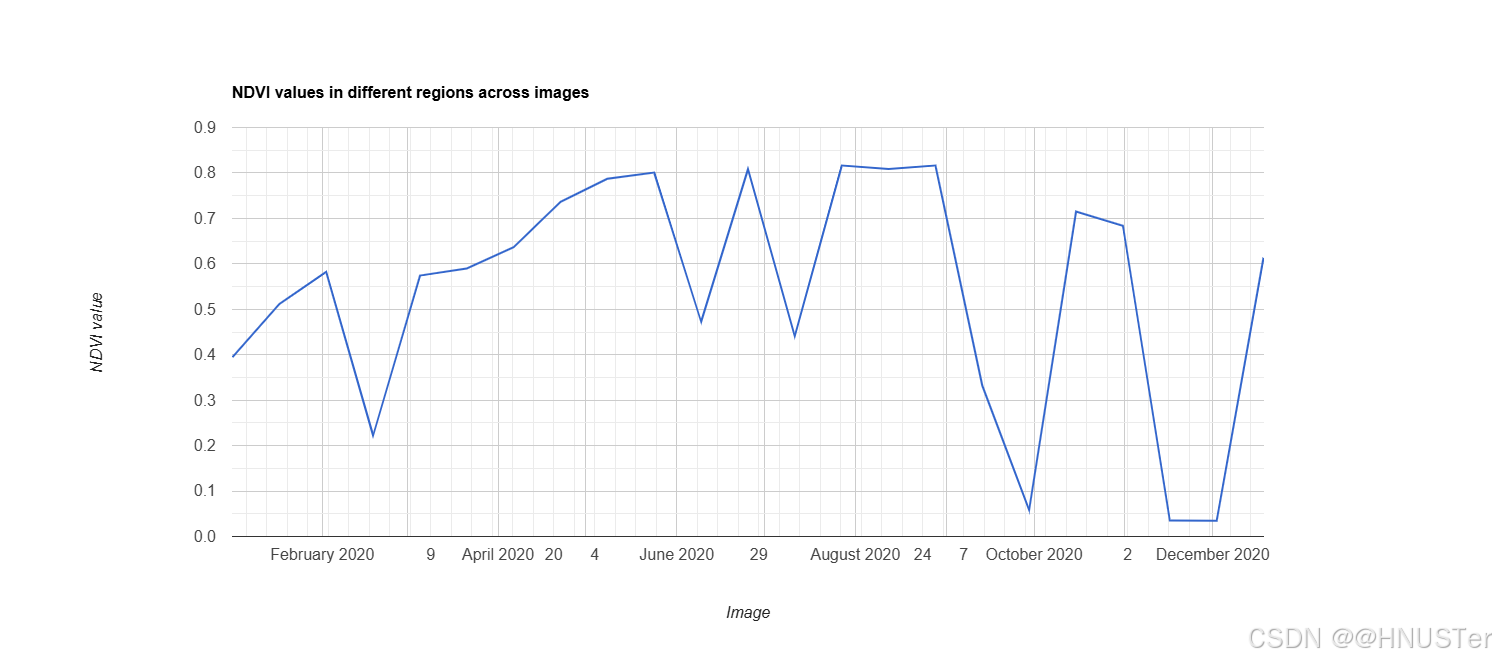
// LineChart 折线图
var chart1 = ui.Chart.image.seriesByRegion({
imageCollection: collection,
regions: roi,
reducer: ee.Reducer.median(), // 统计中值
band: 'NDVI',
scale: 250,
xProperty: 'system:time_start',
seriesProperty: 'label'
});
chart1.setChartType('LineChart');
print(chart1);
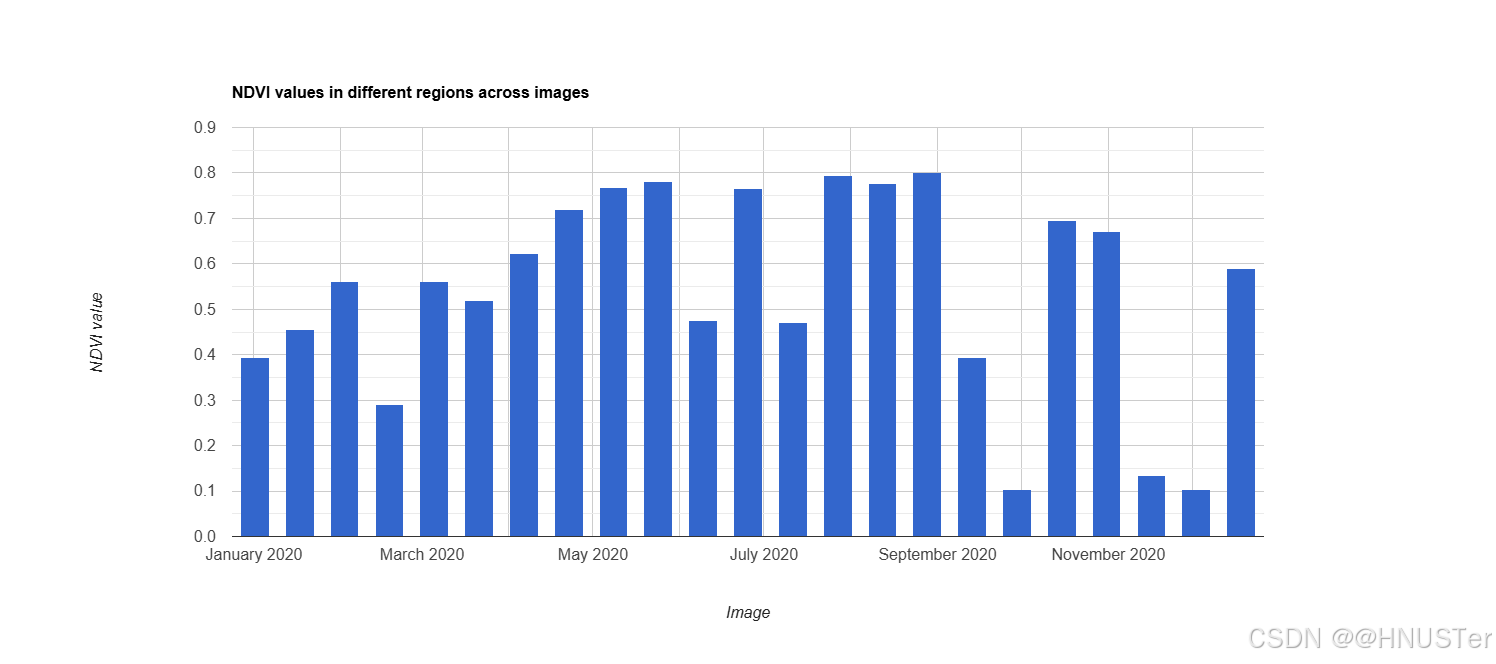
// ColumnChart 柱形图
var chart2 = ui.Chart.image.seriesByRegion({
imageCollection: collection,
regions: roi,
reducer: ee.Reducer.mean(), // 统计均值
band: 'NDVI',
scale: 250,
xProperty: 'system:time_start',
seriesProperty: 'label'
});
chart2.setChartType('ColumnChart');
print(chart2);
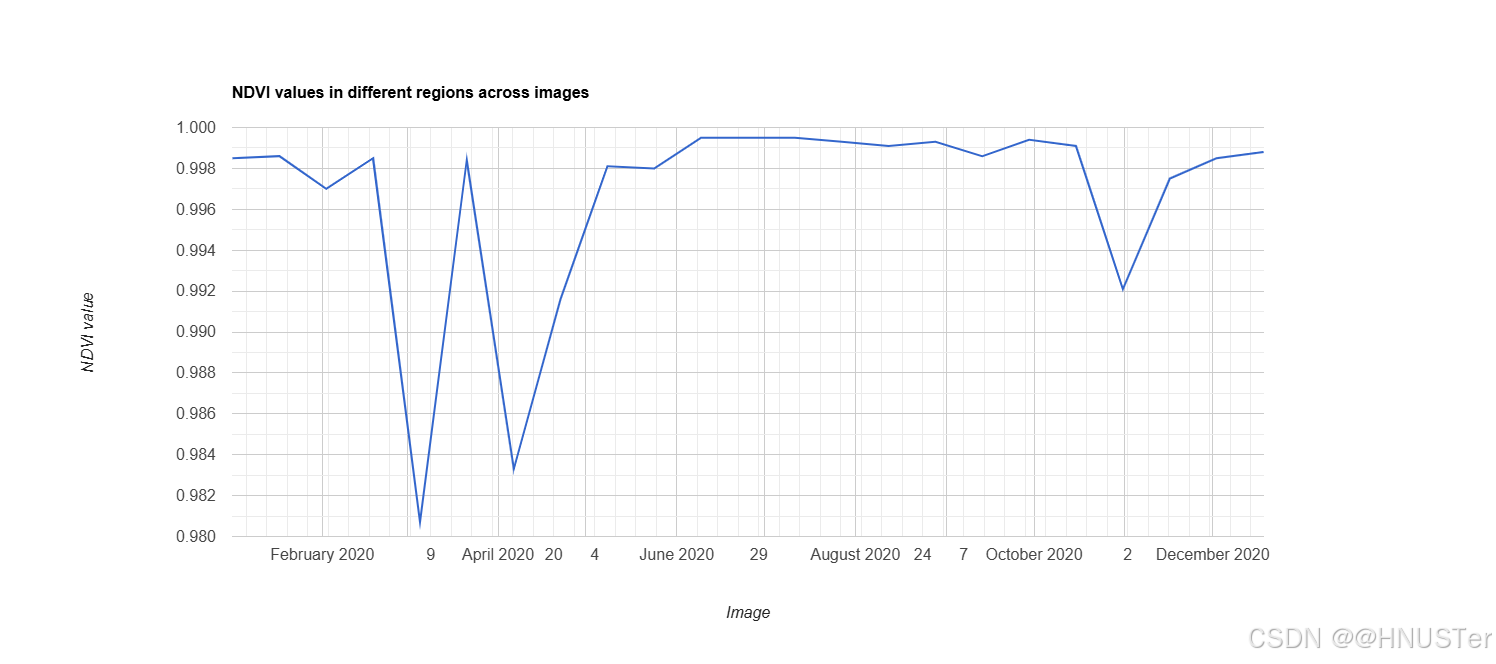
// LineChart 折线图(最大值)
var chart3 = ui.Chart.image.seriesByRegion({
imageCollection: collection,
regions: roi,
reducer: ee.Reducer.max(),
band: 'NDVI',
scale: 250,
xProperty: 'system:time_start',
seriesProperty: 'label'
});
chart3.setChartType('LineChart');
print(chart3);
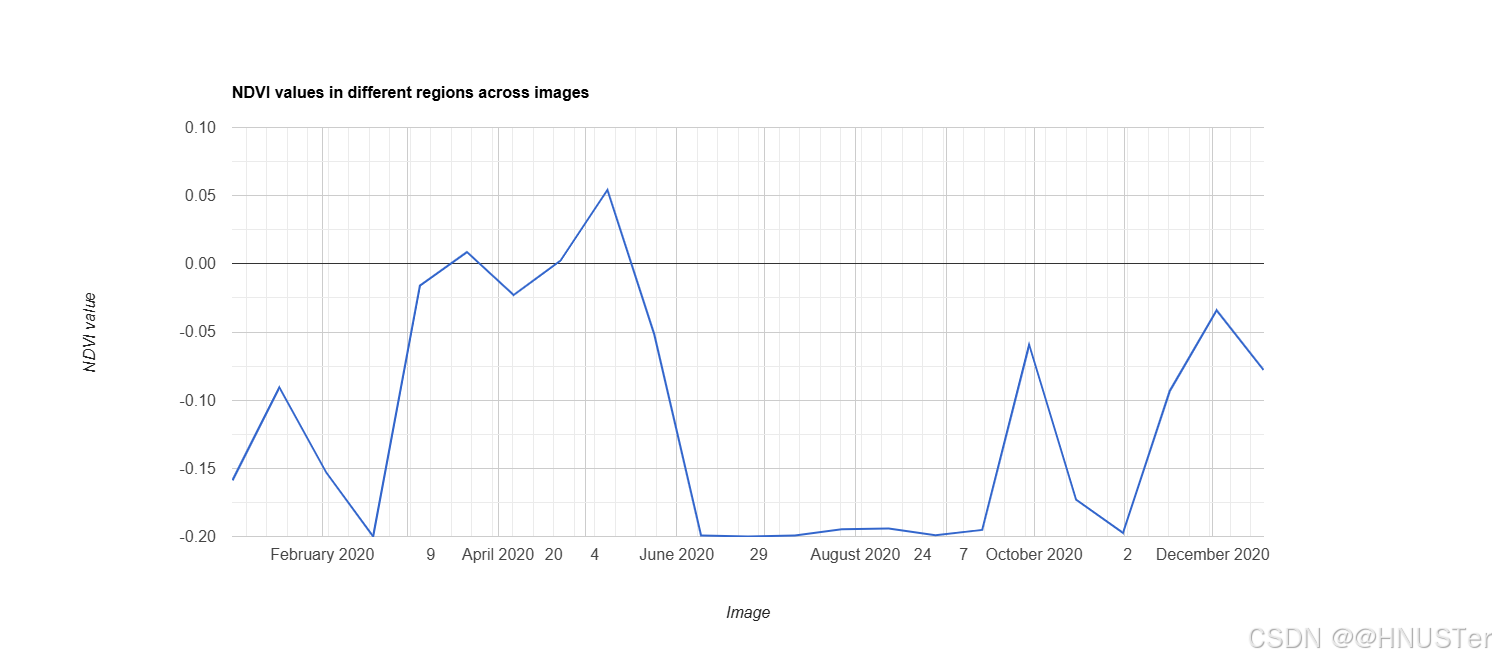
// LineChart 折线图(最小值)
var chart4 = ui.Chart.image.seriesByRegion({
imageCollection: collection,
regions: roi,
reducer: ee.Reducer.min(),
band: 'NDVI',
scale: 250,
xProperty: 'system:time_start',
seriesProperty: 'label'
});
chart4.setChartType('LineChart'); // 这里应该是 chart4,而不是 chart1
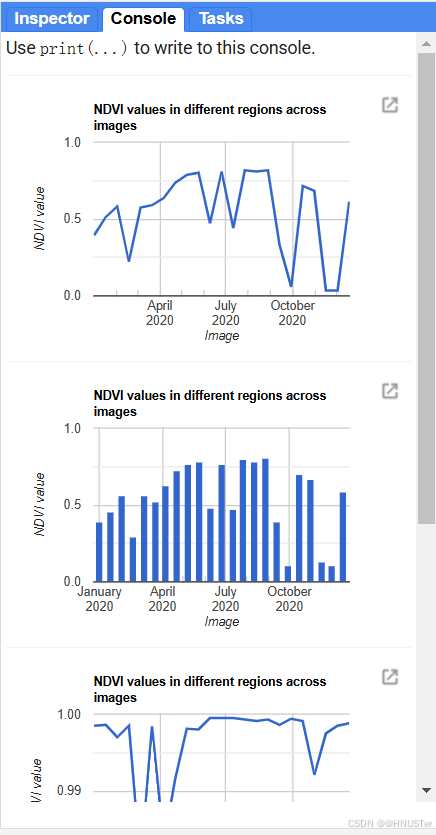
print(chart4);2 运行结果


 被折叠的 条评论
为什么被折叠?
被折叠的 条评论
为什么被折叠?
 到【灌水乐园】发言


