1、sklearn实现
from sklearn.linear_model import LogisticRegression
from sklearn.datasets.samples_generator import make_blobs
import numpy as np, matplotlib.pyplot as mp
from mpl_toolkits import mplot3d
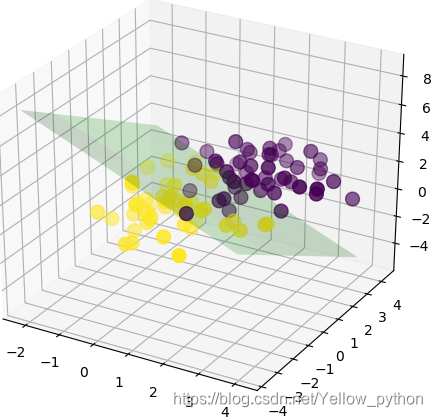
X, y = make_blobs(centers=[[2, 2, 2], [0, 0, 0]], random_state=3)
model = LogisticRegression()
model.fit(X, y)
k = model.coef_[0]
b = model.intercept_[0]
fig = mp.figure()
ax = mplot3d.Axes3D(fig)
ax.scatter(X[:, 0], X[:, 1], X[:, 2], s=99, c=y)
x1 = np.arange(X[:, 0].min()-1, X[:, 0].max()+1, 2)
x2 = np.arange(X[:, 1].min()-1, X[:, 1].max()+1, 2)
x1, x2 = np.meshgrid(x1, x2)
x3 = (b + k[0] * x1 + k[1] * x2) / - k[2]
ax.plot_surface(x1, x2, x3, alpha=0.2, color='g')
mp.show()
2、徒手写一个!
import numpy as np, matplotlib.pyplot as mp
from sklearn.datasets import make_blobs
"""创建随机样本"""
X, Y = make_blobs(centers=2, cluster_std=5)
"""数据处理"""
X = np.insert(X, 0, 1, axis=1)
Y = Y.reshape(-1, 1)
"""sigmoid函数"""
sigmoid = lambda x: 1 / (1 + np.exp(-x))
"""梯度上升"""
d = X.shape[1]
theta = np.mat([[1]] * d)
for i in range(5999, 8999):
alpha = 1 / i
h = sigmoid(X * theta)
theta = theta + alpha * X.T * (Y - h)
"""数据可视化"""
x1, x2 = X[:, 1], X[:, 2]
mp<
 逻辑回归实战


 最低0.47元/天 解锁文章


 2404
2404

 被折叠的 条评论
为什么被折叠?
被折叠的 条评论
为什么被折叠?
 到【灌水乐园】发言


