


 本文档介绍了如何在Vue项目中使用Echarts图表框架。首先通过npm或cnpm安装echarts,然后全局引入到main.js。接着在vue组件中,创建带有宽高的div作为图表容器,再在methods中定义绘制图表的方法,并在mounted钩子中实例化echarts对象。最后展示了实现实例后的效果及更多应用方法。
文章目录
官方文档(配置项)
官方文档(教程)
官方文档(API)
1.在项目中安装依赖
- npm安装
npm install echarts --save
npm install echarts -S
- cnpm 淘宝镜像安装(速度更快)
npm install -g cnpm --registry=https://registry.npm.taobao.org
cnpm install echarts -S
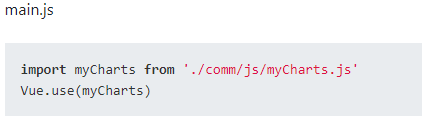
2.全局引入echarts,在mian.js中:
import echarts from 'echarts'
Vue.prototype.$echarts = echarts
如图:

3.写代码,在xxx.vue中
1.在template标签中放两个有宽高的div来装图标
<template>
  <div>
    <div id="myChart" :style="{width: '300px', height: '300px'}"></div>
    <div id="container" :style="{width: '870px', height: '290px'}"></div>
  </div>
</template>
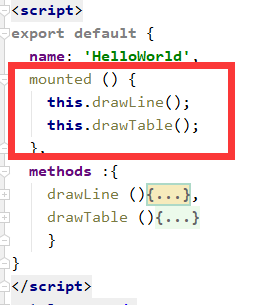
2.script标签中methods中写画图表的方法
<script>
export default {
  name: 'HelloWorld',
  mounted () {
    this.drawLine();
    this.drawTable();
  },
  methods :{
    drawLine (){
      // 基于准备好的dom,初始化echarts实例
      let myChart = this.$echarts.init(document.getElementById('myChart'))
      // 绘制图表
      myChart.setOption({
        title: { text: '在Vue中使用echarts' },
        tooltip: {},
        xAxis: {
          data: ["衬衫","羊毛衫","雪纺衫","裤子","高跟鞋","袜子"]
        },
        yAxis: {},
        series: [{
          name: '销量',
          type: 'bar',
          data: [5, 20, 36, 10, 10, 20]
        }]
      });
    },
    drawTable (){
      var dom=document.getElementById("container");
      let myChart2=this.$echarts.init(dom);
      //载入数据
      myChart2.setOption({
        tooltip: {
          trigger: 'item'
        },
        toolbox: {
          show: true,
        },
        xAxis: {
          type: 'category',
          axisTick:{
            show:false
          },
          boundaryGap: false,
          data: ['01:30', '03:24', '05:19', '08:50', '12:08', '15:11', '20:05']
        },
        yAxis: {
          type: 'value',
          axisLine: {
            onZero: false,
            show:false //不显示Yz

          },
          axisTick:{
            show:false
          },
          axisLabel: {
            formatter: '{value} °C',
            margin:20
          },
          boundaryGap: false,
          scale: true,
          max:29,
          min:24


        },
        series: [
          {
            name: '最高气温',
            type: 'line',
            smooth: true,
            itemStyle:{
              color: 'rgba(109,212,0,1)'
            },
            lineStyle: {
              width: 3,
              color: 'rgba(109,212,0,1)'
            },
            data: [28.8,26.6,27,26.8,25.5,24.5,24.6]

          }
        ]
      });
    }
    }
}
</script>
3.在mounted生命周期函数中实例化echarts对象,确保dom元素已经挂载到页面中
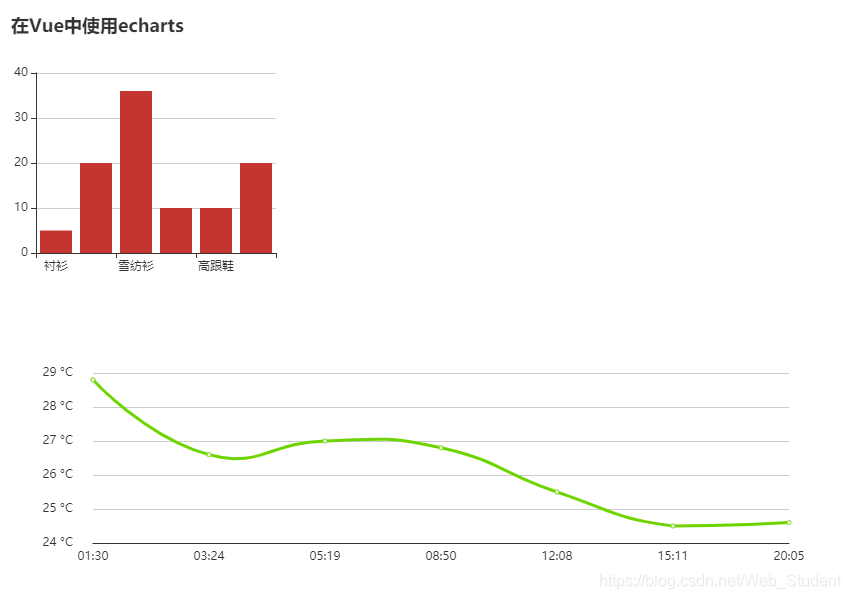
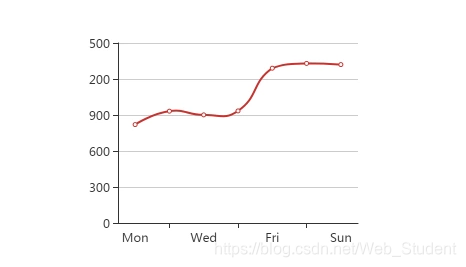
4.结果
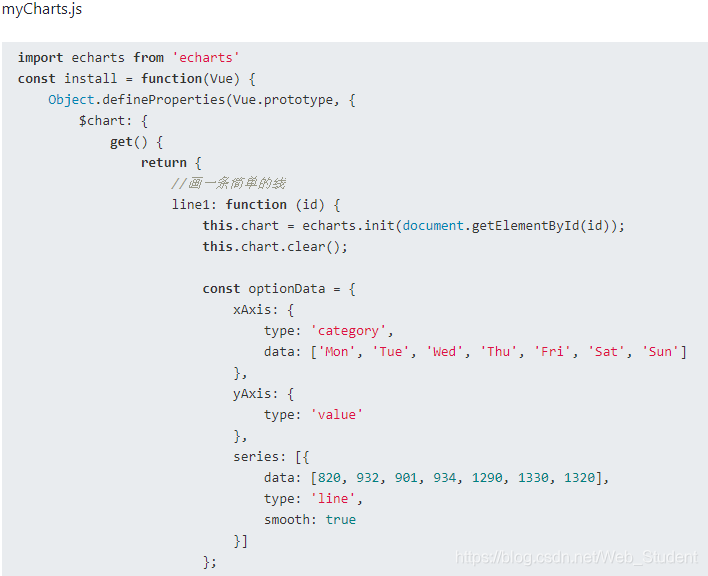
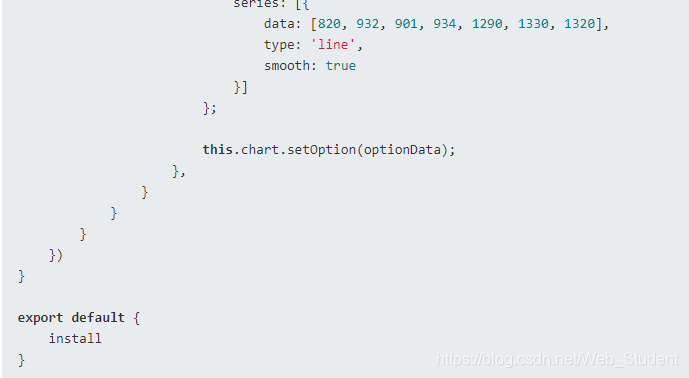
5.其他方法
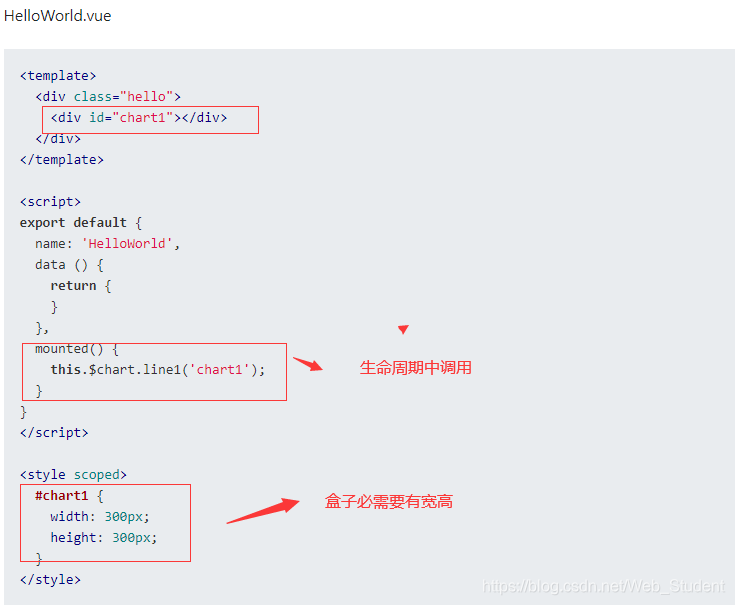
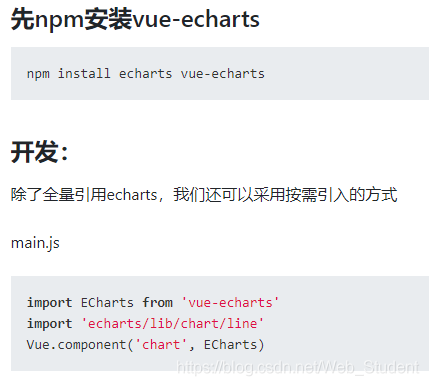
6.使用vue-echarts


 9572
9572


 到【灌水乐园】发言


