


 本文详细介绍了如何在 SQL Plus 中使用 AUTOTRACE 功能,包括其语法、不同选项的作用及如何查看 SQL 语句的执行计划和统计数据。此外还提供了执行计划结果的解读方法。
SET AUTOTRACE(转载)
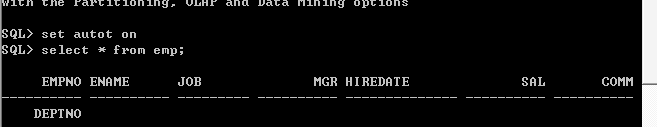
注意;*autotrace功能只能在SQL*PLUS里使用
声明:本文为转载,如果有侵犯知识版权,请通知本人,本人将即刻停止侵权行为:
网址;http://blog.youkuaiyun.com/huanghui22/article/details/1326227
https://netfiles.uiuc.edu/jstrode/www/oraplus/plus_set_autotrace.html
http://www.cnblogs.com/chinhr/archive/2009/03/14/1412105.html
http://www.linuxidc.com/Linux/2012-06/62802.htm
http://docs.oracle.com/cd/B19306_01/server.102/b14200/statements_9010.htm#i2061796
http://docs.oracle.com/cd/B19306_01/server.102/b14357/ch8.htm#i1037226
explan plan的各个参数的解释:
http://docs.oracle.com/cd/B19306_01/server.102/b14211/ex_plan.htm
SET AUTOTRACE
Displays a report on the execution of successful SQL DML statements (SELECT, INSERT, UPDATE or DELETE).
Prerequisites:
| ♦ Must have PLUSTRCE role. Run $ORACLE_HOME/sqlplus/admin/plustrce.sql as SYS to create. |
| ♦ Must have PLAN_TABLE in user schema. Run $ORACLE_HOME/rdbms/admin/utlxplan.sql To set up for use by non-dba users: create public synonym plan_table for system.PLAN_TABLE and GRANT all on plan_table to public or have them set up a PLAN_TABLE in their own schema. |
| Syntax: | SET AUTOTRACE { OFF | ON | TRACEONLY } [EXPLAIN] [STATISTICS] |
| SET AUTOT OFF | ||
| No AUTOTRACE report is generated. This is the default. | ||
| SET AUTOT ON | ||
ON displays a trace report. Same as SET AUTOT ON EXP STAT The AUTOTRACE report includes data queried, the optimizer execution path and the SQL statement execution statistics. | ||
| SET AUTOT ON EXPLAIN | ||
| EXPLAIN shows the query execution path by performing an EXPLAIN PLAN. The AUTOTRACE report includes the data queried and only the optimizer execution path | ||
| SET AUTOT ON STATISTICS | ||
| Displays SQL statement statistics. The AUTOTRACE report includes the data queried and the SQL statement execution statistics. | ||
| SET AUTOT ON EXPLAIN STATISTICS | ||
| SET AUTOT TRACE | ||
TRACE is the same as ON but supresses the queried data. Same as entering SET AUTOT TRACE EXP STAT. The AUTOTRACE report includes data queried, the optimizer execution path and the SQL statement execution statistics. | ||
| SET AUTOT TRACE EXPLAIN | ||
| EXPLAIN shows the query execution path by performing an EXPLAIN PLAN. The AUTOTRACE report show the SQL statement execution statistics. | ||
| SET AUTOT TRACE STATISTICS | ||
| STATISTICS displays SQL statement statistics. The AUTOTRACE report show the SQL statement execution statistics. | ||
| SET AUTOT TRACE EXPLAIN STATISTICS | ||
http://download-west.oracle.com/docs/cd/A97630_01/server.920/a90842/ch9.htm#1006527
| Related Commands: | |
| EXPLAIN PLAN | |
| SHOW TIMING | Shows the value of a SQLPlus system variable(s) or current SQLPlus environment. |
| CLEAR TIMING | |
| SET TIMING | Reports the elapsed time to execute every query in milliseconds or 1/10 of a second. |
| Related Views: | |
| V$TIMER | |
| V$SESSION | Lists session information for each current session. |
| Related Packages: | |
| DBMS_UTILITY.GET_TIME |
执行计划:
执行计划的结果:
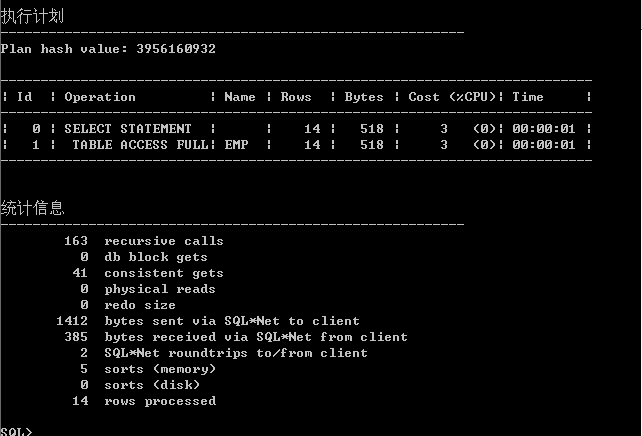
physical reads 物理读——执行SQL的过程中,从硬盘上读取的数据块个数
redo size 重做数——执行SQL的过程中,产生的重做日志的大小
bytes set via sql*net to client 通过sql*net发送给客户端的字节数
bytes received via sql*net from client 通过sql*net接受客户端的字节数
sorts(memory) 在内存中发生的排序
sorts(disk) 不能在内存中发生的排序,需要硬盘来协助
rows processed 结果的记录数
| 项目 | 含义 | 备注 |
| recursive calls | 递归调用SQL的个数;Oracle在执行这个SQL的时候,有时候会生成很多额外的SQL语句,这个就成为递归调用; |
|
| db block gets | 逻辑读,从数据buffer cache中读取;进行current模式读取; |
|
| consistent gets | 逻辑读,进行一致读模式读取; |
|
| physical reads | 物理读成本; |
|
| redo size | 产生重做日志大小 |
|
| bytes sent via SQL*Net to client | 利用sql*net传入到client的字节数; |
|
| bytes received via SQL*Net from client | 利用sql*net传出client的字节数; |
|
| SQL*Net roundtrips to/from client |
|
|
| sorts (memory) | 内存中排序空间使用; |
|
| sorts (disk) | 物理存储中排序空间使用; | 如果memory空间使用不足,是会使用disk的空间的; |


 355
355

 被折叠的 条评论
为什么被折叠?
被折叠的 条评论
为什么被折叠?
 到【灌水乐园】发言


