


 本文介绍了一种使用奇异值分解(SVD)进行图像压缩和重构的方法。通过将图像转换为多个特征的线性组合,可以减少存储空间并保持图像质量。文章详细展示了如何通过Python实现这一过程,并提供了完整的代码示例。
简介
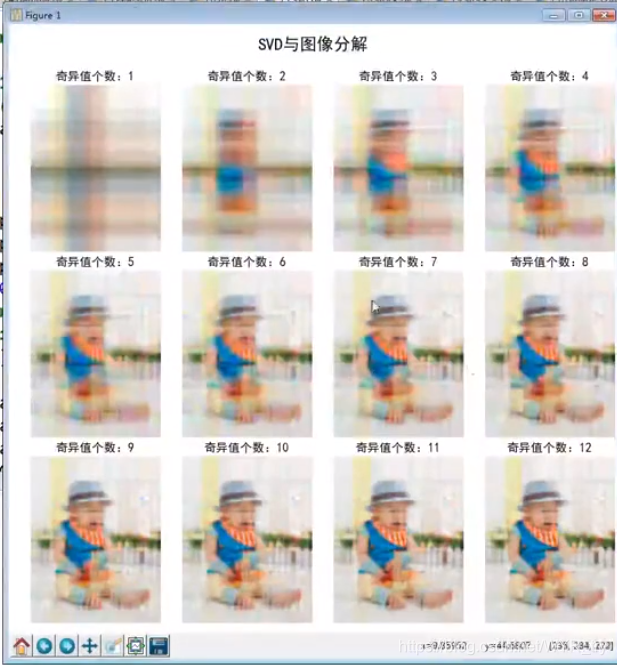
用svd将图片转变为多个特征的线性加和
源码
def restore1(sigma,u,v,k):#奇异值,左特征向量,右特征向量
	print k
	m=len(u)
	n=len(v[0])
	a=np.zeros((m,n))
	for k in range(k+1):
		for i in range(m):
			a[i]+=sigma[k]*u[i][k]*v[k]
	b=a.astype('uint8')
	Image.fromarray(b).save("svd_"+str(k)+".png")
A=Image.open("test.png",'r')
print A
output_path=r'.\svd1'
if not os.path.exits(output_path):
	os.mkdir(output_path)
a=np.array(A)
print a.shape
K=50
u_r ,sigma_r,v_r=np.linalg.svd([:,:,0])
u_g ,sigma_g.v_g=np.linalg.svd([:,:,1])
u_b ,sigma_b.v_b=np.linalg.svd([:,:,2])
pit.figure(figsize=(10,10),facecolor='w')
mpl.rcParams['font.sans-serif']=[u'simHei']
mpl.rcParams['axes.unicode_minus']=False
for k in range(1,K+1):
	print k
	R=restore1(sigma_r,u_r,v_r,k)
	G=restore1(sigma_g,u_g,v_g,k)
	B=restore1(sigma_b,u_b,v_b,k)
	I=np.stack((R,G,B).axis=2)
	Image.fromarray(I).save('%s\\svd_%d.png'%(output_path,k))
	if k<=12:
		plt.subplot(3,4,k)
		plt.imshow(I)
		plt.axis('off')
		plt.title(u'奇异值个数:%d'%k)
plt.suptitle(u'SVD与图像分解',fontsize=20)
plt.tight_layout(0.3,rect=(0,0,1,0.92))
plt.show()


 907
907

 被折叠的 条评论
为什么被折叠?
被折叠的 条评论
为什么被折叠?
 到【灌水乐园】发言


