


书接上文,把水球图写成固定组件,以下是文件格式结构:
结构如下:
src/
├── components/
│   └── LiquidFillChart.vue
├── views/
│   └── demo/
│       └── plugins/
│           └── import/
│               └── index.vue
以下是添加了详细注释的代码,帮助你更好地理解每一部分的作用:
<template>
  <!-- 卡片容器,用于包裹标题和图表 -->
  <div class="chart-card" ref="chartCard">
    <!-- 标题部分,如果传入了 title 则显示 -->
    <div v-if="title" class="chart-title">{{ title }}</div>
    <!-- 图表容器,用于渲染水球图 -->
    <div ref="chart" class="chart-container"></div>
  </div>
</template>

<script>
// 引入 echarts 和 echarts-liquidfill 插件
import * as echarts from 'echarts';
import 'echarts-liquidfill';

export default {
  name: 'LiquidFillChart', // 组件名称
  props: {
    // 标题属性,默认值为 '水球图标题'
    title: {
      type: String,
      default: '水球图标题'
    },
    // 数据属性,默认值为 [0.6, 0.5, 0.4, 0.3]
    data: {
      type: Array,
      default: () => [0.6, 0.5, 0.4, 0.3]
    },
    // 水球图半径属性,默认值为 '80%'
    radius: {
      type: String,
      default: '80%'
    }
  },
  data() {
    return {
      myChart: null // 用于存储 echarts 实例
    };
  },
  mounted() {
    // 在 DOM 更新后初始化图表,并监听窗口大小变化
    this.$nextTick(() => {
      this.initChart();
      this.adjustContainerSize();
      window.addEventListener('resize', this.resizeChart);
    });
  },
  beforeDestroy() {
    // 组件销毁前移除事件监听器并销毁图表实例
    window.removeEventListener('resize', this.resizeChart);
    if (this.myChart) {
      this.myChart.dispose();
    }
  },
  methods: {
    // 初始化图表
    initChart() {
      const chartDom = this.$refs.chart; // 获取图表容器的 DOM 元素
      this.myChart = echarts.init(chartDom); // 初始化 echarts 实例

      // 配置项
      const option = {
        series: [{
          type: 'liquidFill', // 使用水球图类型
          data: this.data, // 使用 props 中的数据
          radius: this.radius, // 使用 props 中的半径
          outline: { show: false }, // 不显示外边框
          label: {
            show: true, // 显示标签
            formatter: param => `${(param.value * 100).toFixed(0)}%`, // 格式化标签内容为百分比
            fontSize: 28, // 字体大小
            color: '#fff', // 字体颜色
            fontWeight: 'bold', // 字体加粗
            textShadow: '2px 2px 4px rgba(0, 0, 0, 0.5)' // 文字阴影
          },
          backgroundStyle: {
            color: '#E6F7FF', // 背景颜色
            borderWidth: 10, // 背景边框宽度
            borderColor: '#1890FF', // 背景边框颜色
            shadowBlur: 10, // 背景阴影模糊度
            shadowColor: 'rgba(0, 0, 0, 0.3)' // 背景阴影颜色
          },
          itemStyle: {
            color: {
              type: 'linear', // 使用线性渐变
              x: 0, // 渐变起始点 x 坐标
              y: 0, // 渐变起始点 y 坐标
              x2: 0, // 渐变结束点 x 坐标
              y2: 1, // 渐变结束点 y 坐标
              colorStops: [
                { offset: 0, color: '#1890FF' }, // 渐变起始颜色
                { offset: 1, color: '#0050B3' } // 渐变结束颜色
              ]
            },
            shadowBlur: 10, // 水球阴影模糊度
            shadowColor: 'rgba(0, 0, 0, 0.5)' // 水球阴影颜色
          }
        }]
      };

      this.myChart.setOption(option); // 设置图表配置项
    },
    // 调整图表容器大小
    resizeChart() {
      if (this.myChart) {
        this.myChart.resize(); // 调整图表大小
        this.adjustContainerSize(); // 调整容器大小
      }
    },
    // 动态调整容器大小
    adjustContainerSize() {
      this.$nextTick(() => {
        const chartCard = this.$refs.chartCard; // 获取卡片容器的 DOM 元素
        const chartDom = this.$refs.chart; // 获取图表容器的 DOM 元素
        if (chartCard && chartDom) {
          // 设置图表容器的高度等于卡片的宽度,确保水球图是正方形
          chartDom.style.height = `${chartCard.clientWidth}px`;
          this.myChart.resize(); // 重新调整图表大小
        }
      });
    }
  }
};
</script>

<style scoped>
/* 卡片容器样式 */
.chart-card {
  display: flex;
  flex-direction: column;
  align-items: center;
  background: #ffffff;
  border-radius: 15px;
  box-shadow: 5px 5px 15px rgba(0, 0, 0, 0.2);
  padding: 10px;
  width: fit-content; /* 宽度适应内容 */
}

/* 标题样式 */
.chart-title {
  font-size: 26px;
  font-weight: bold;
  color: #333;
  margin-bottom: 10px;
  margin-top: 30px;
  text-align: center;
}

/* 图表容器样式 */
.chart-container {
  width: 400px; /* 固定宽度 */
  height: 400px; /* 固定高度 */
}
</style>
注释说明:
-
模板部分 (
<template>):chart-card:卡片容器,用于包裹标题和图表。chart-title:标题部分,如果传入了title则显示。chart-container:图表容器,用于渲染水球图。
-
脚本部分 (
<script>):props:定义了组件的属性,包括title、data和radius。data:定义了组件的内部状态,myChart用于存储 echarts 实例。mounted:在组件挂载后初始化图表,并监听窗口大小变化。beforeDestroy:在组件销毁前移除事件监听器并销毁图表实例。initChart:初始化图表并设置配置项。resizeChart:调整图表大小。adjustContainerSize:动态调整容器大小,确保水球图是正方形。
-
样式部分 (
<style>):.chart-card:卡片容器的样式。.chart-title:标题的样式。.chart-container:图表容器的样式。
使用示例:
<template>
  <div>
    <LiquidFillChart
      title="水球图示例"
      :data="[0.6, 0.5, 0.4, 0.3]"
      radius="85%"
    />
  </div>
</template>

<script>
import LiquidFillChart from '@/components/LiquidFillChart.vue';

export default {
  components: {
    LiquidFillChart
  }
};
</script>
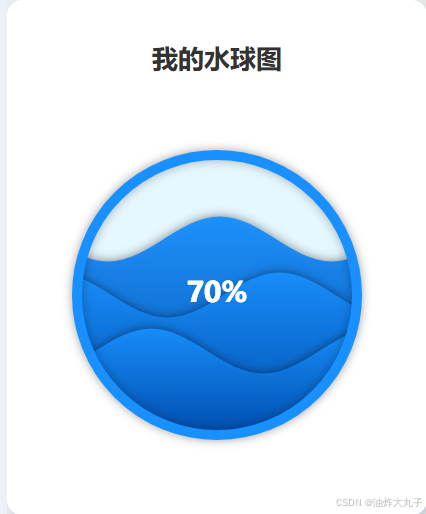
效果:
- 卡片宽度和高度自适应内容。
- 水球图大小固定为
400px * 400px。 - 标题和图表布局合理,样式美观。


 被折叠的 条评论
为什么被折叠?
被折叠的 条评论
为什么被折叠?
 到【灌水乐园】发言


