


 本文详细介绍了如何在Mac环境下配置Laradock的PHPStorm集成Xdebug。首先在laradock的.env文件中启用Xdebug安装,接着修改laradock/php-fpm/xdebug.ini配置,并重新构建容器。然后在PHPStorm中设置Servers和Debug配置,通过验证确保Xdebug正确安装。最后,你可以开始使用Xdebug进行Http和CLI请求的调试。
本文以Mac为例,如果是Windows则将docker.for.mac.localhost改为 docker.for.win.localhost
1. 首先打开 laradock 项目的 .env 文件,定位到下面两行:
# laradock/.env

WORKSPACE_INSTALL_XDEBUG=true

PHP_FPM_INSTALL_XDEBUG=false
将这两个选项设为 true 会分别在 workspace 和 php-fpm 容器中安装 xdebug 拓展
在 php-fpm 中安装 xdebug 是用来调试 Http 请求,比如调试浏览器、Postman 发起的请求,workspace 中安装 xdebug 可以调试 CLI 请求,比如 Artisan 命令、PHP 脚本
2. 打开 laradock/php-fpm/xdebug.ini 文件,将前两行修改为如下:
# laradock/php-fpm/xdebug.ini
  xdebug.remote_host=docker.for.mac.localhost
  xdebug.remote_connect_back=0
  xdebug.remote_port=9000
  xdebug.idekey=PHPSTORM

  xdebug.remote_autostart=1
  xdebug.remote_enable=1
  xdebug.cli_color=0
  xdebug.profiler_enable=0
  xdebug.profiler_output_dir="~/xdebug/phpstorm/tmp/profiling"

  xdebug.remote_handler=dbgp
  xdebug.remote_mode=req

  xdebug.var_display_max_children=-1
  xdebug.var_display_max_data=-1
  xdebug.var_display_max_depth=-1
之后重新构建容器:
$ docker-compose up -d --force-recreate --build workspace php-fpm
我一般只在 php-fpm 安装 Xdebug,印象中在 workspace 安装 Xdebug 后调试时会收到很多调试请求,有点烦人
查看 xdebug 是否安装成功(该命令仅可查看 php-fpm 容器的 xdebug):
$ ./php-fpm/xdebug status

xDebug status
PHP 7.2.15 (cli) (built: Feb 21 2019 23:48:47) ( NTS )
Copyright (c) 1997-2018 The PHP Group
Zend Engine v3.2.0, Copyright (c) 1998-2018 Zend Technologies
    with Zend OPcache v7.2.15, Copyright (c) 1999-2018, by Zend Technologies
    with Xdebug v2.7.2, Copyright (c) 2002-2019, by Derick Rethans
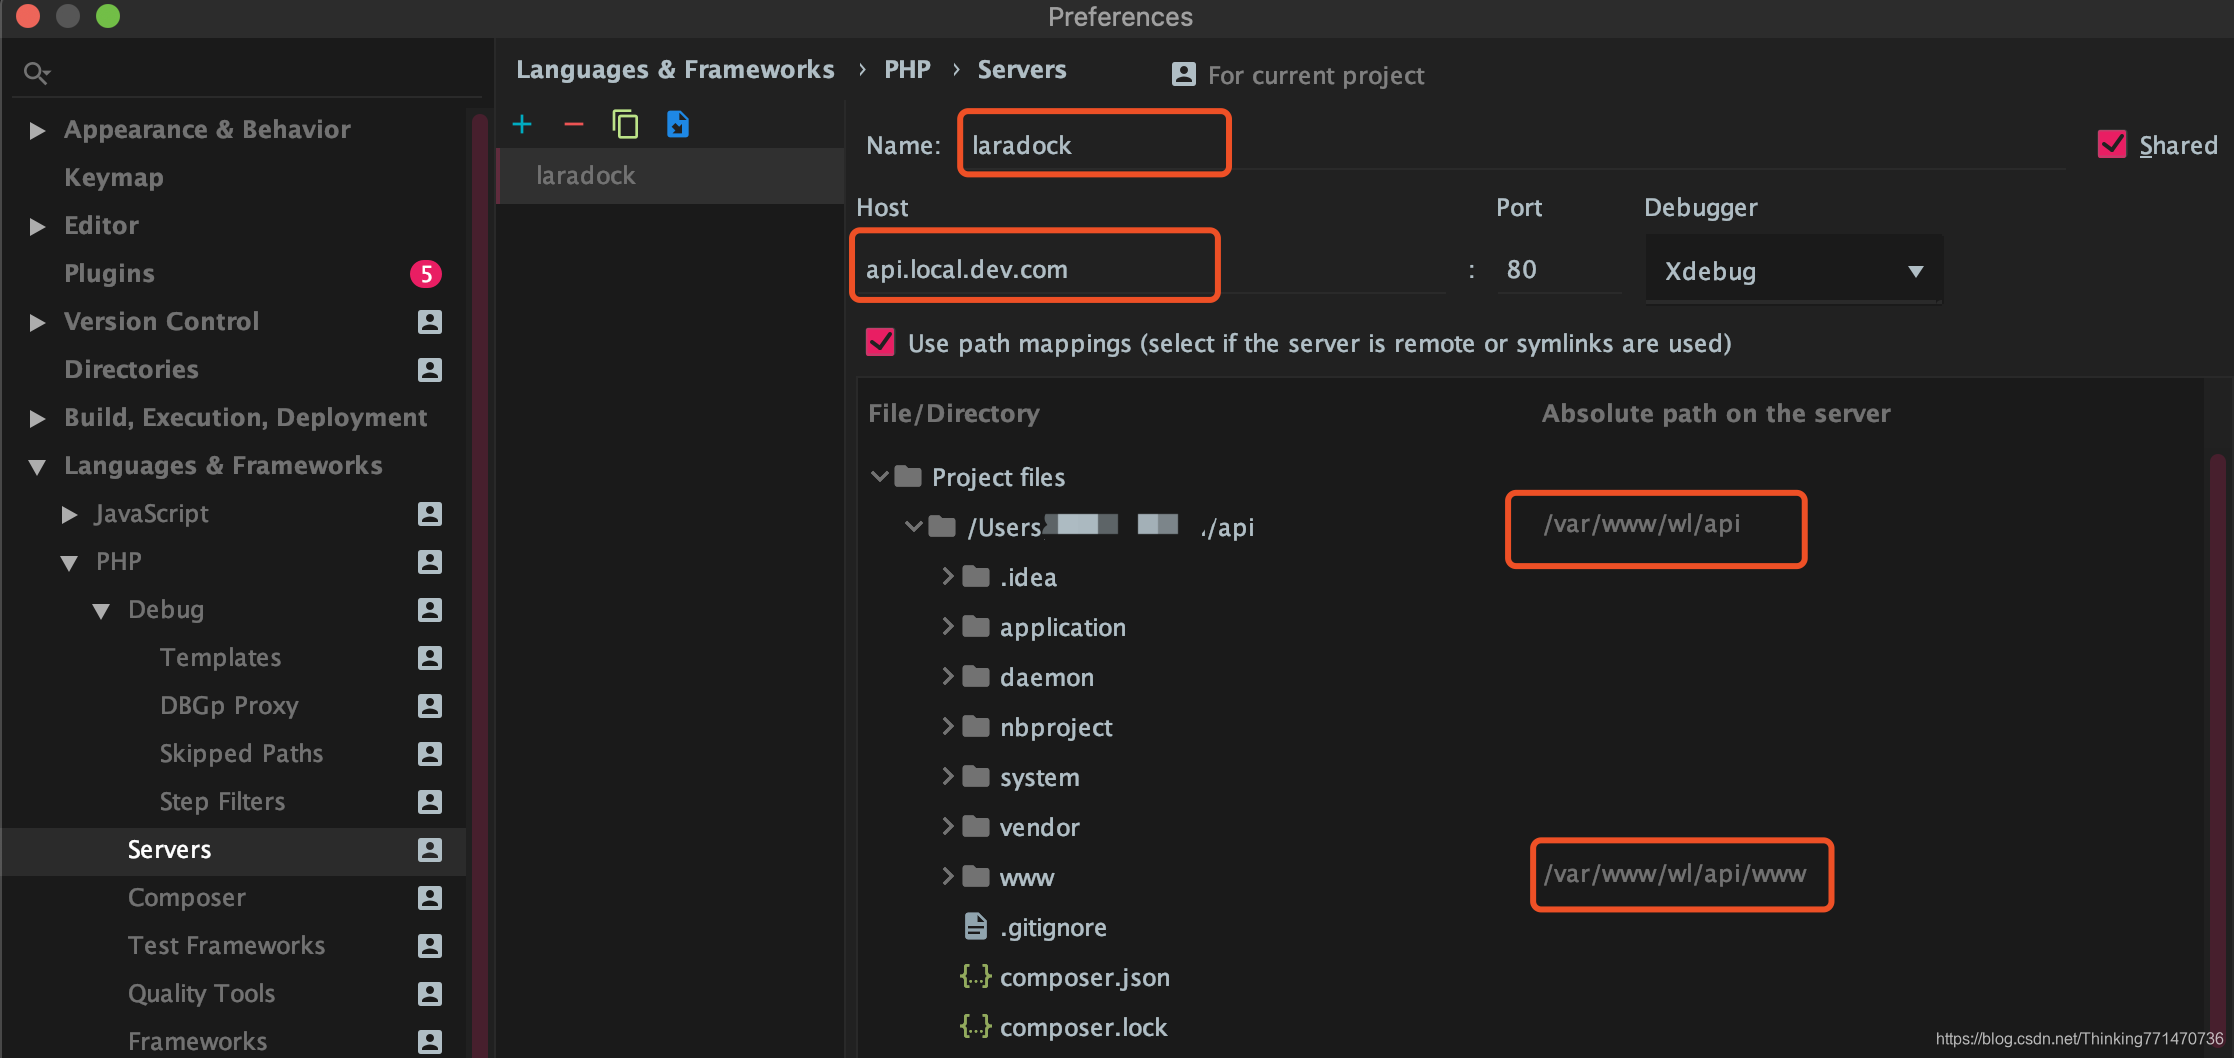
3. PHPStorm 设置:Preferences->Language & Frameworks->PHP->Servers,新建一个 server,这里取名 laradocker
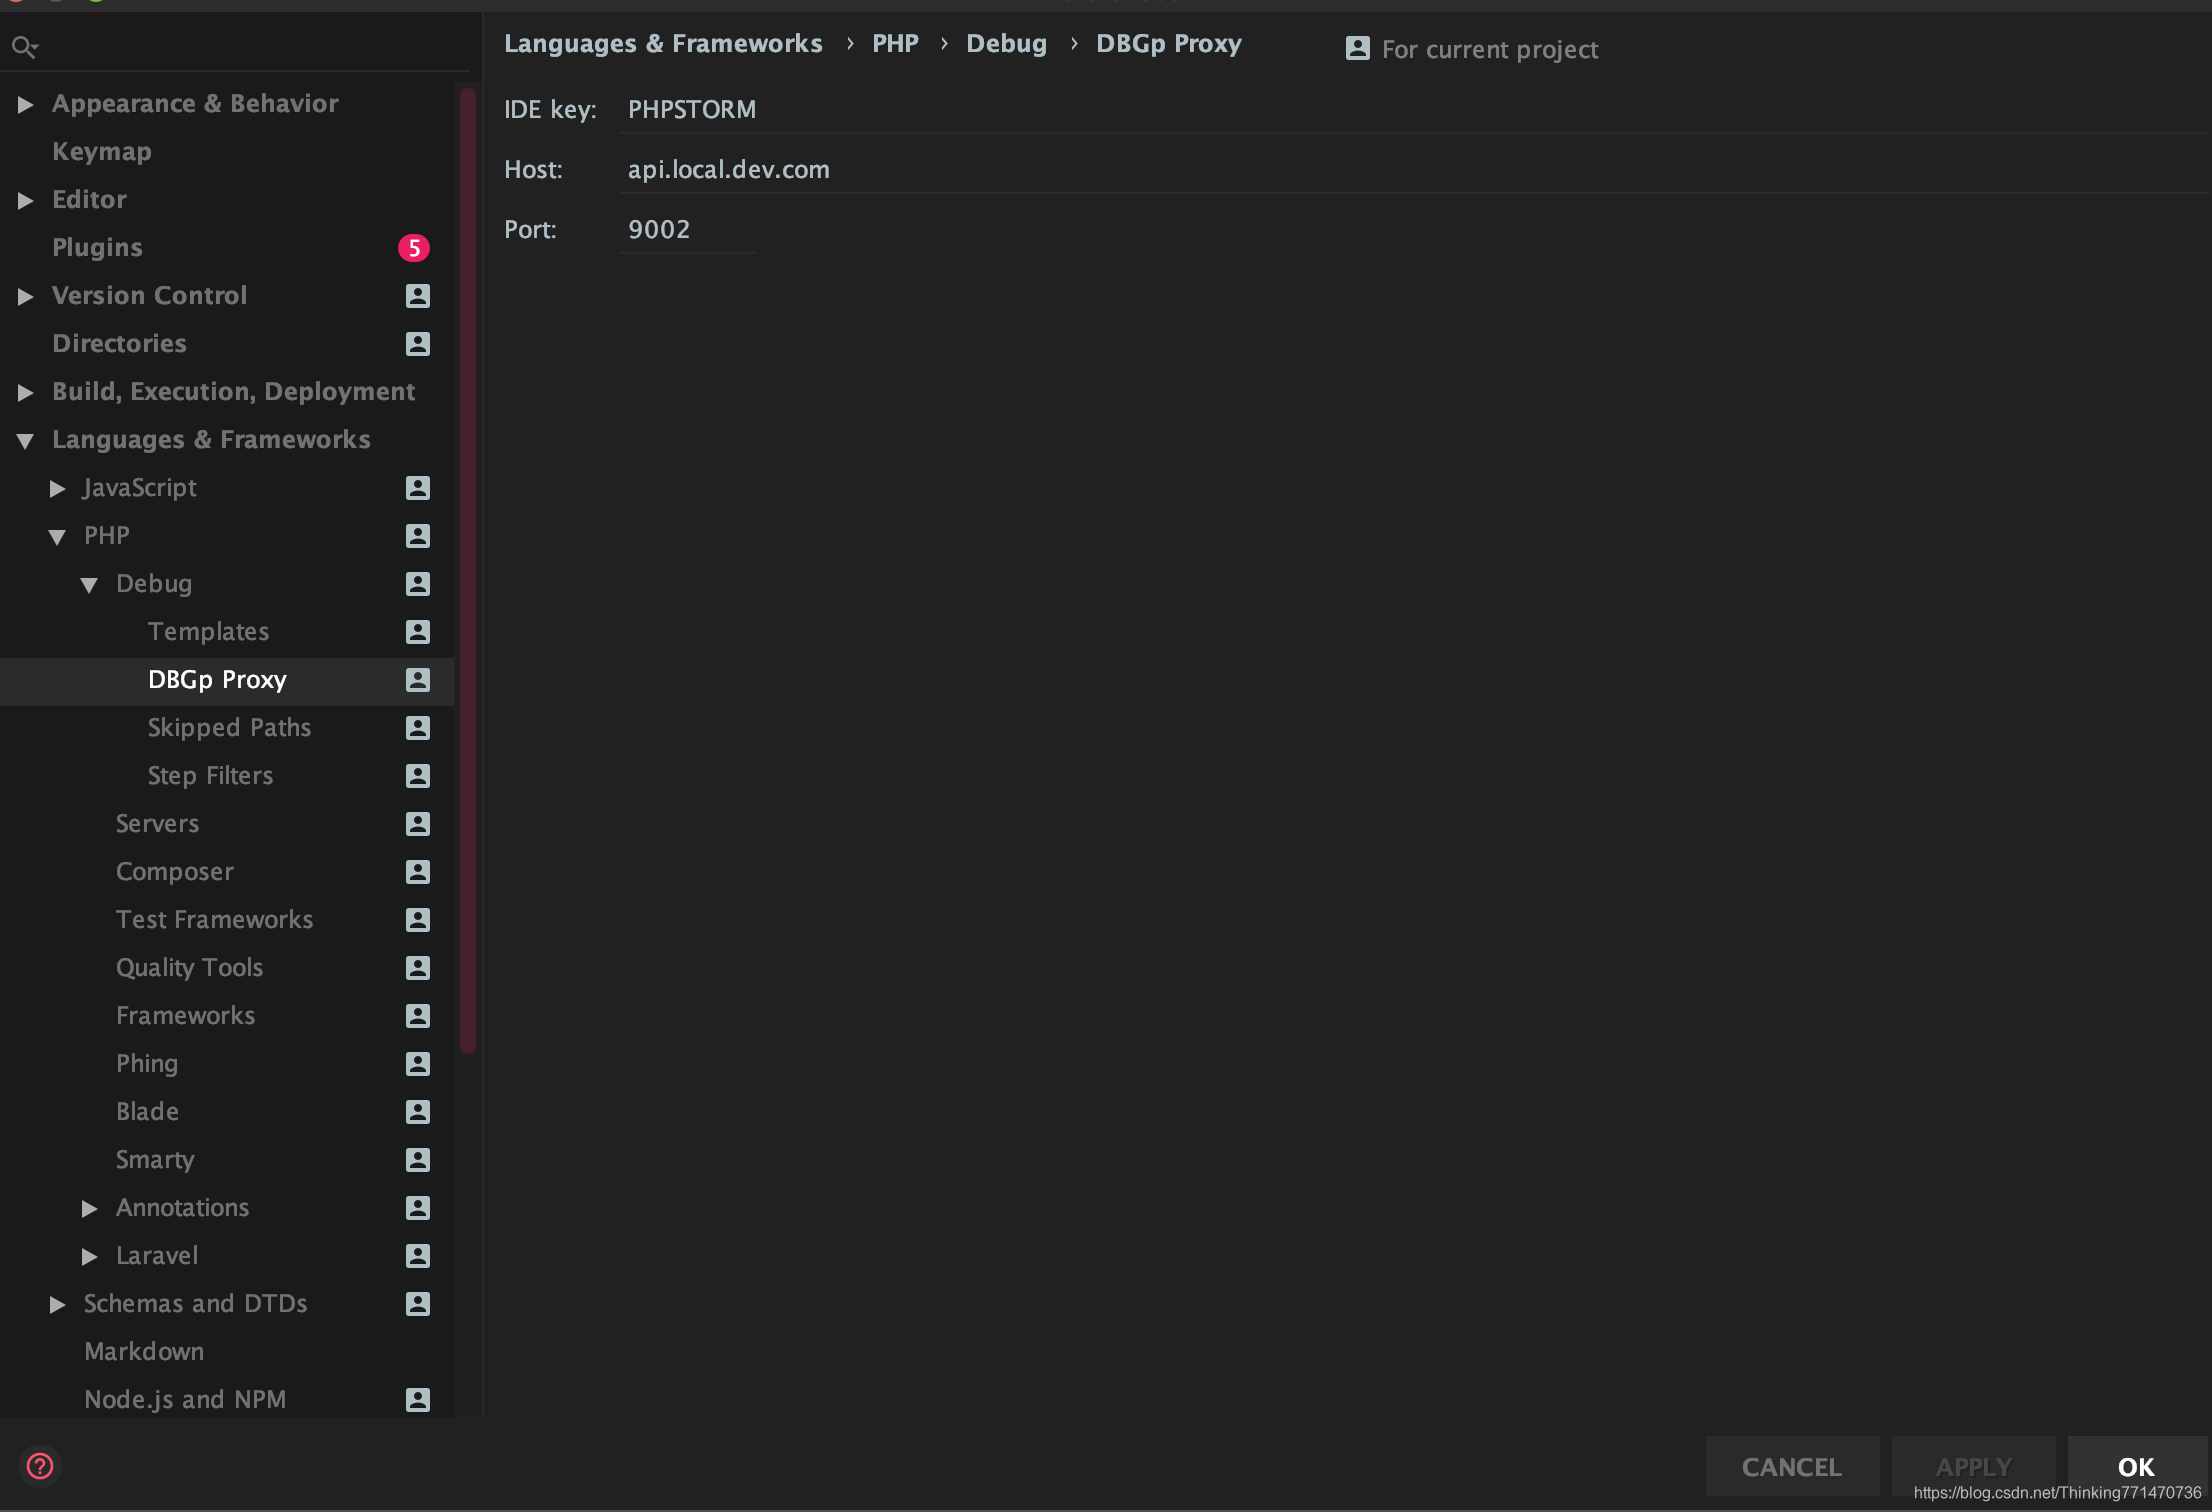
然后配置Debug:
然后添加debug-config
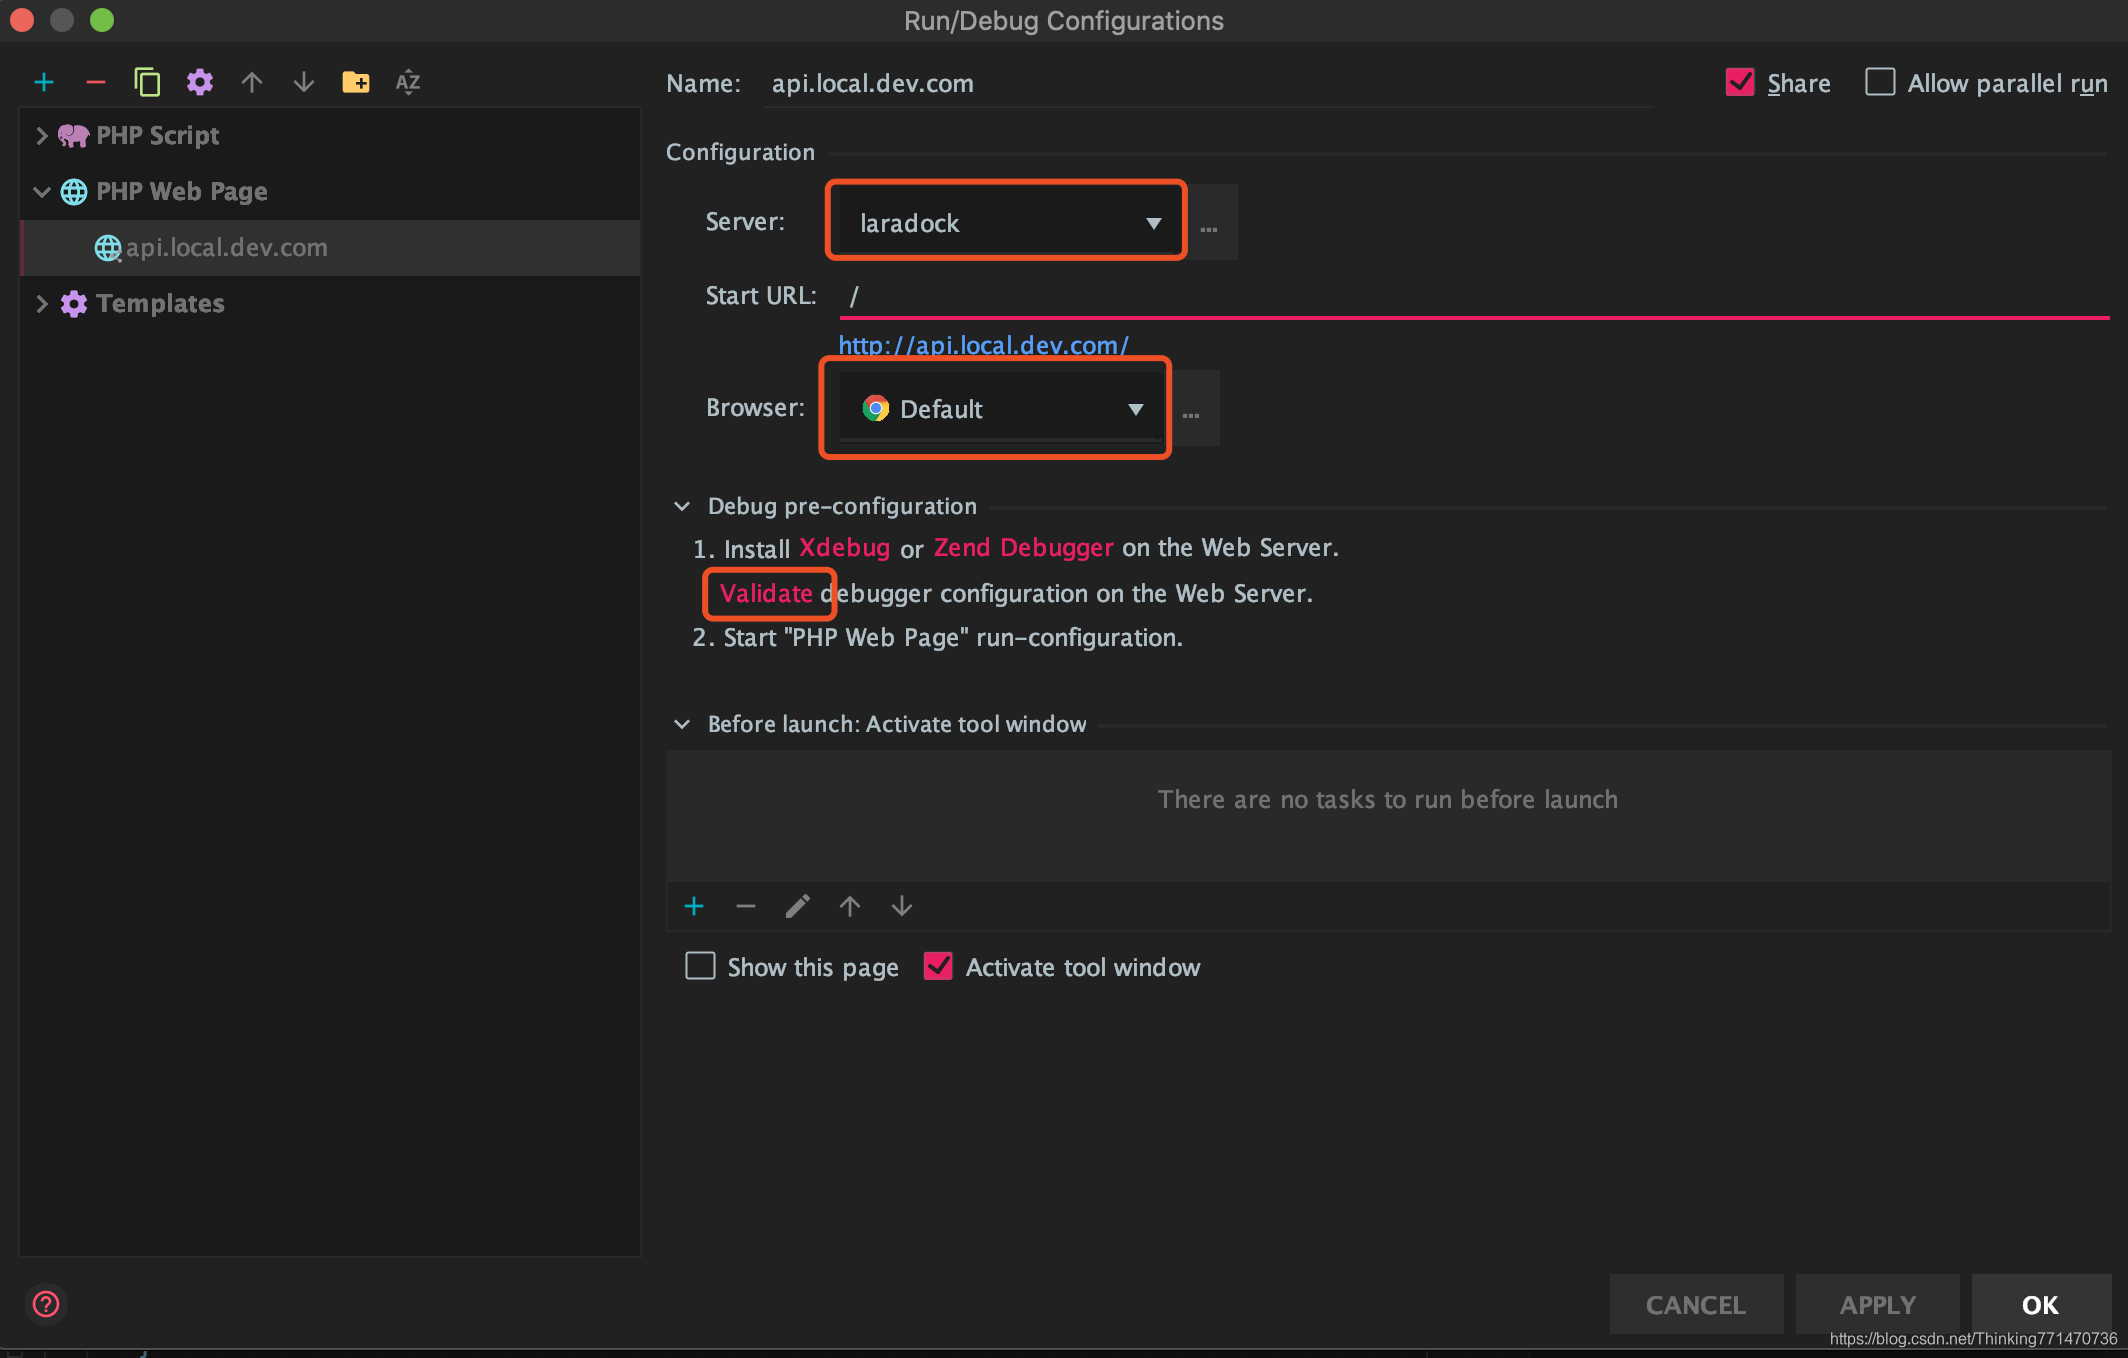
可以使用Validate查看debug配置,如下图
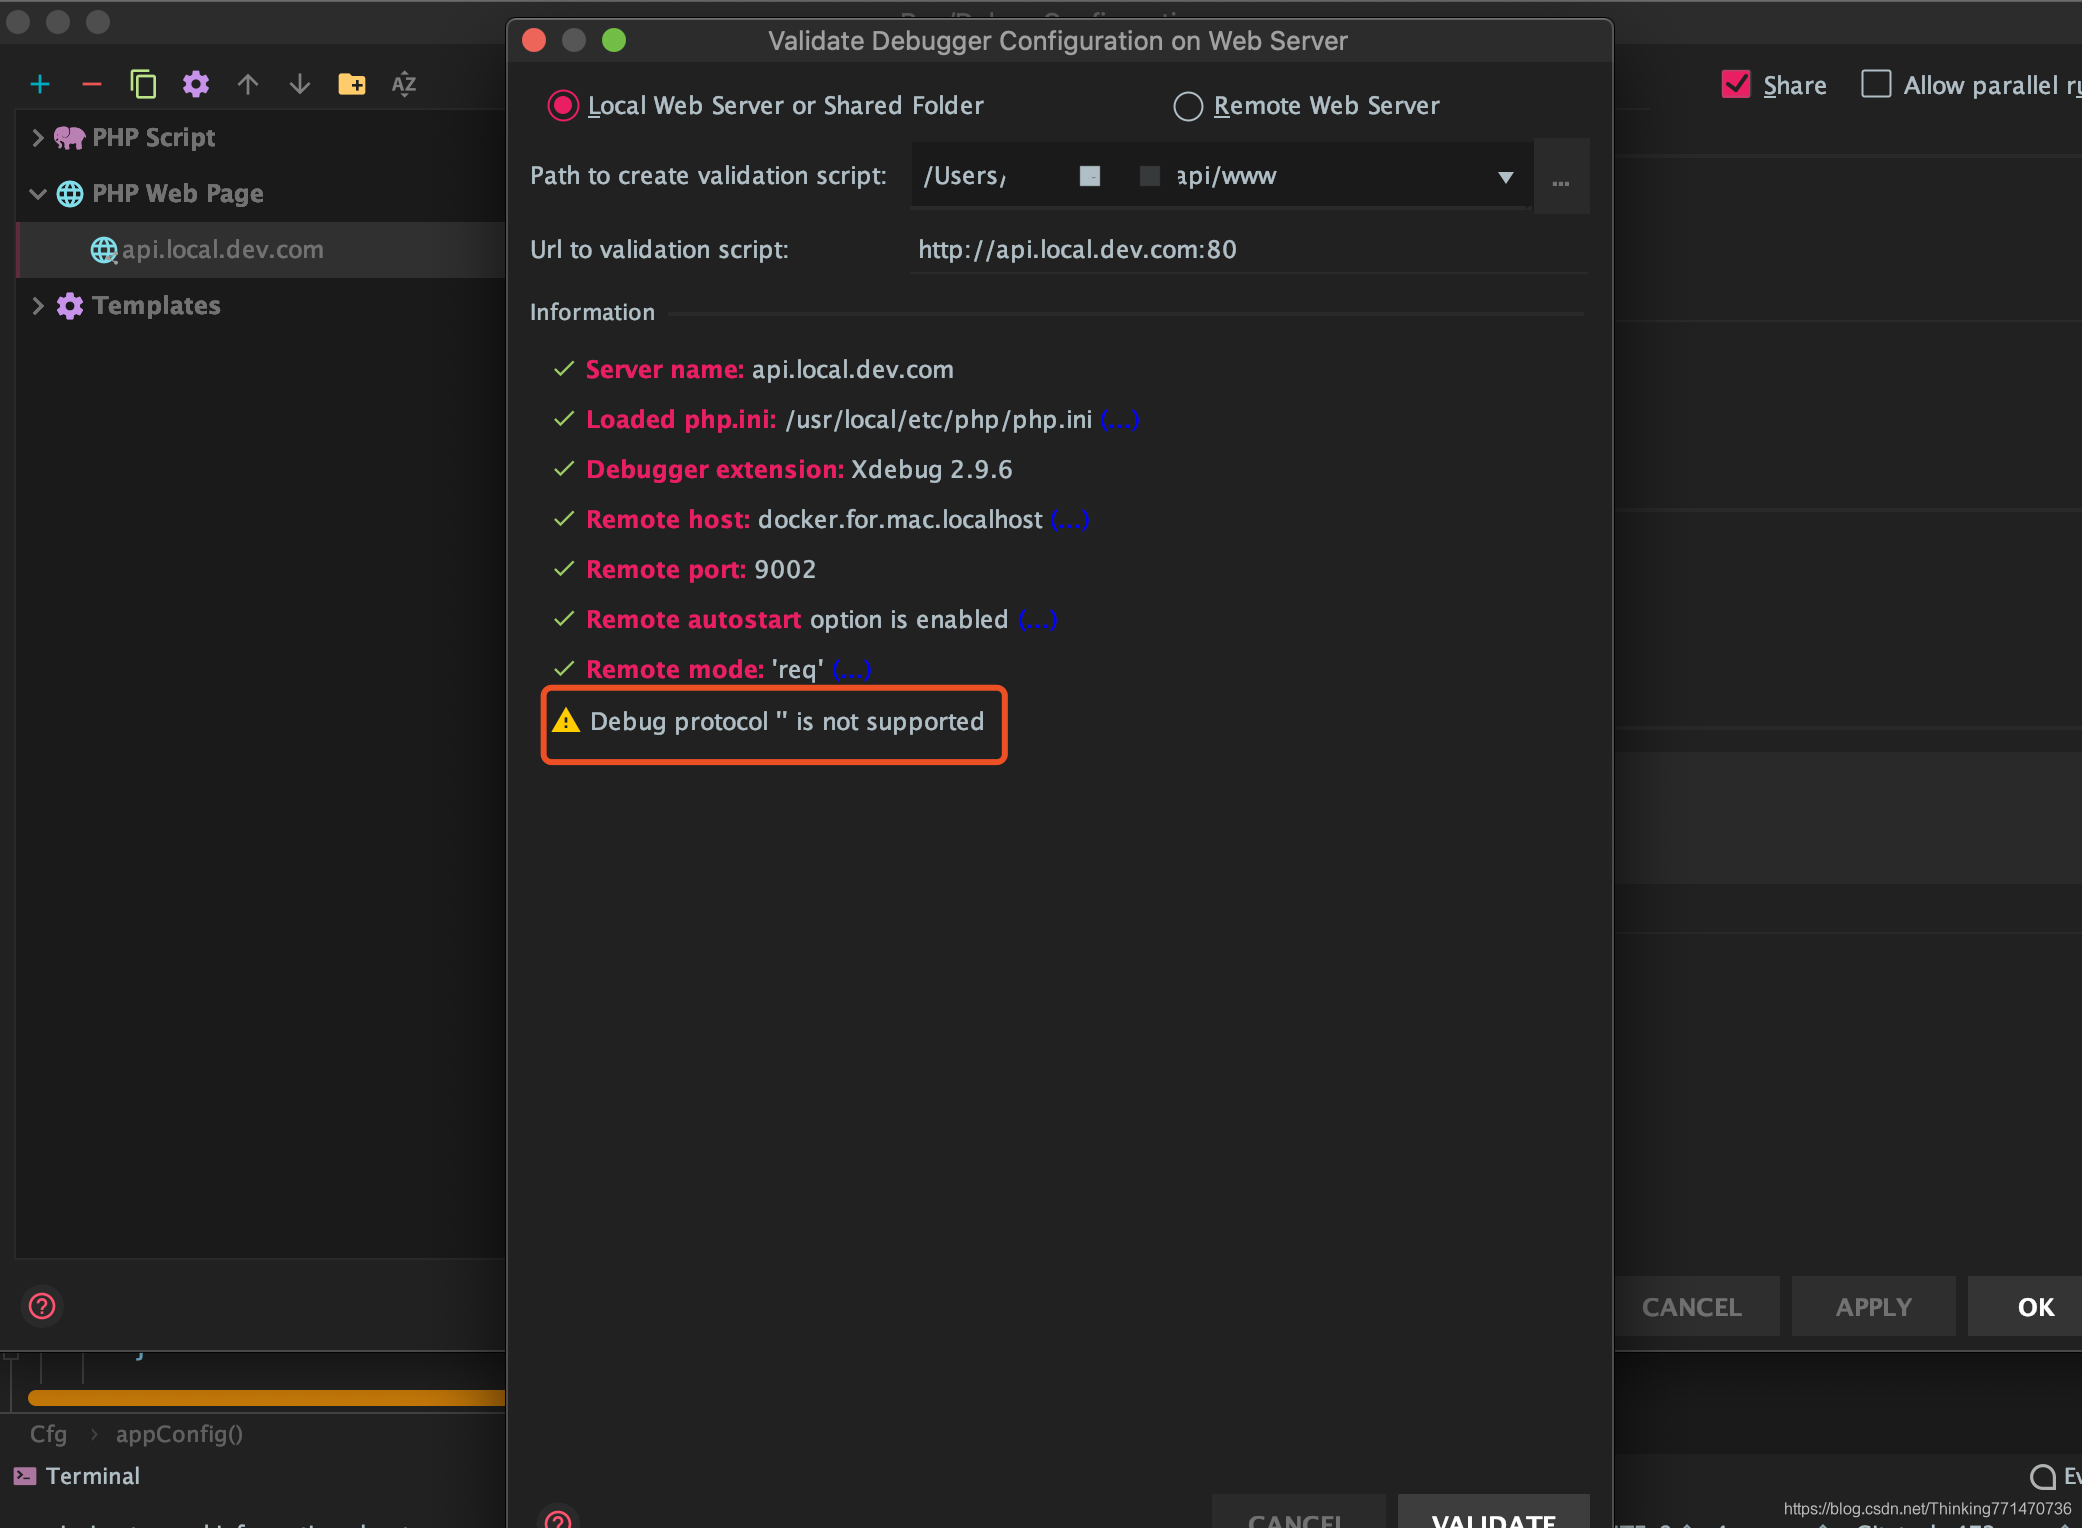
检测完成,debug protocol error是因为2.9版本中已经移除了这个异常,所以不用管
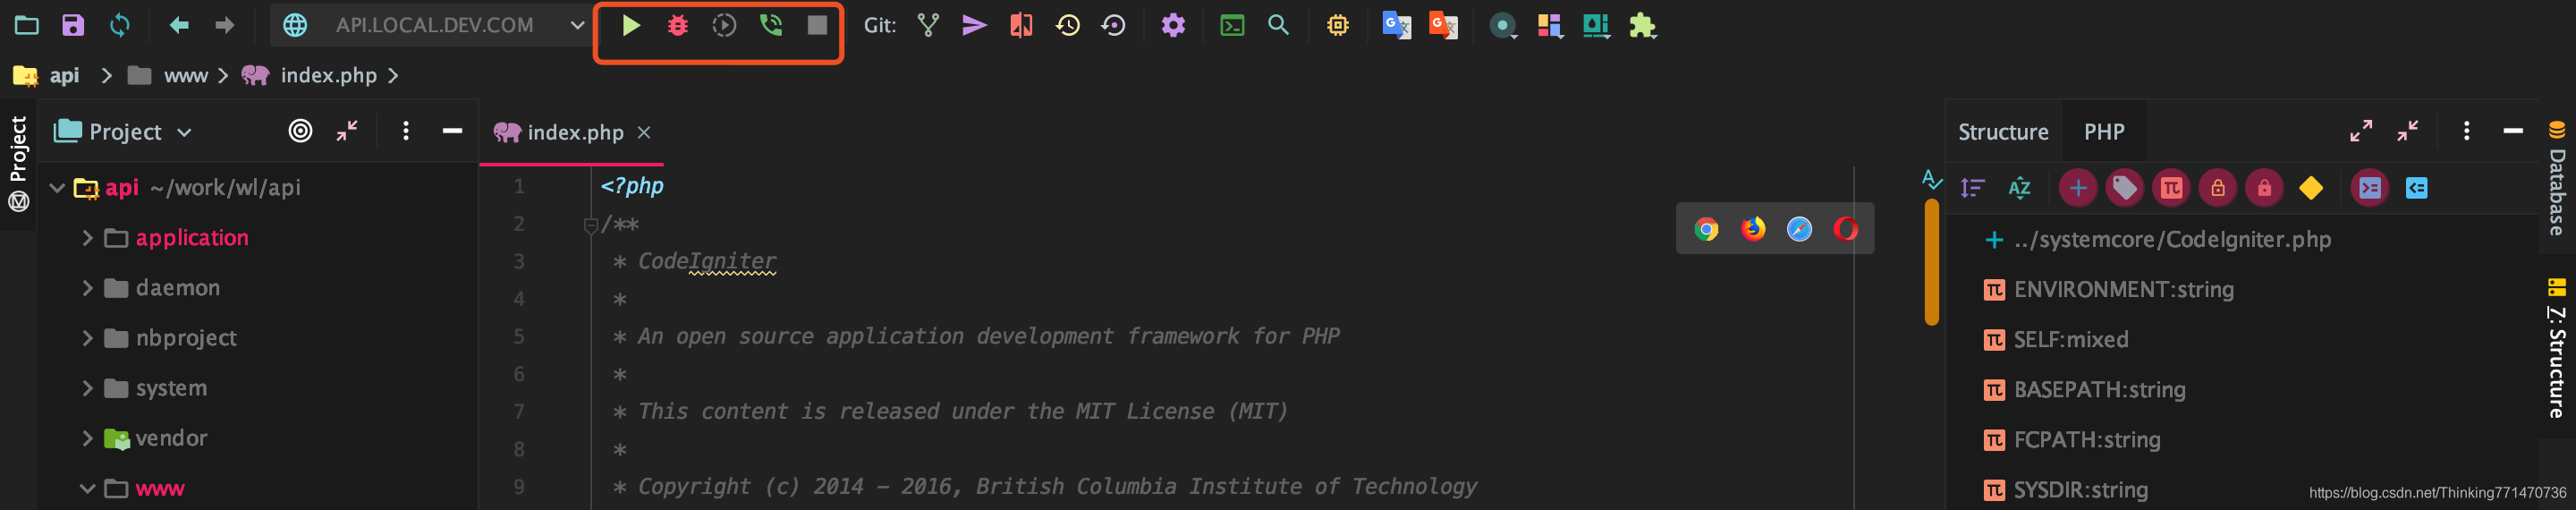
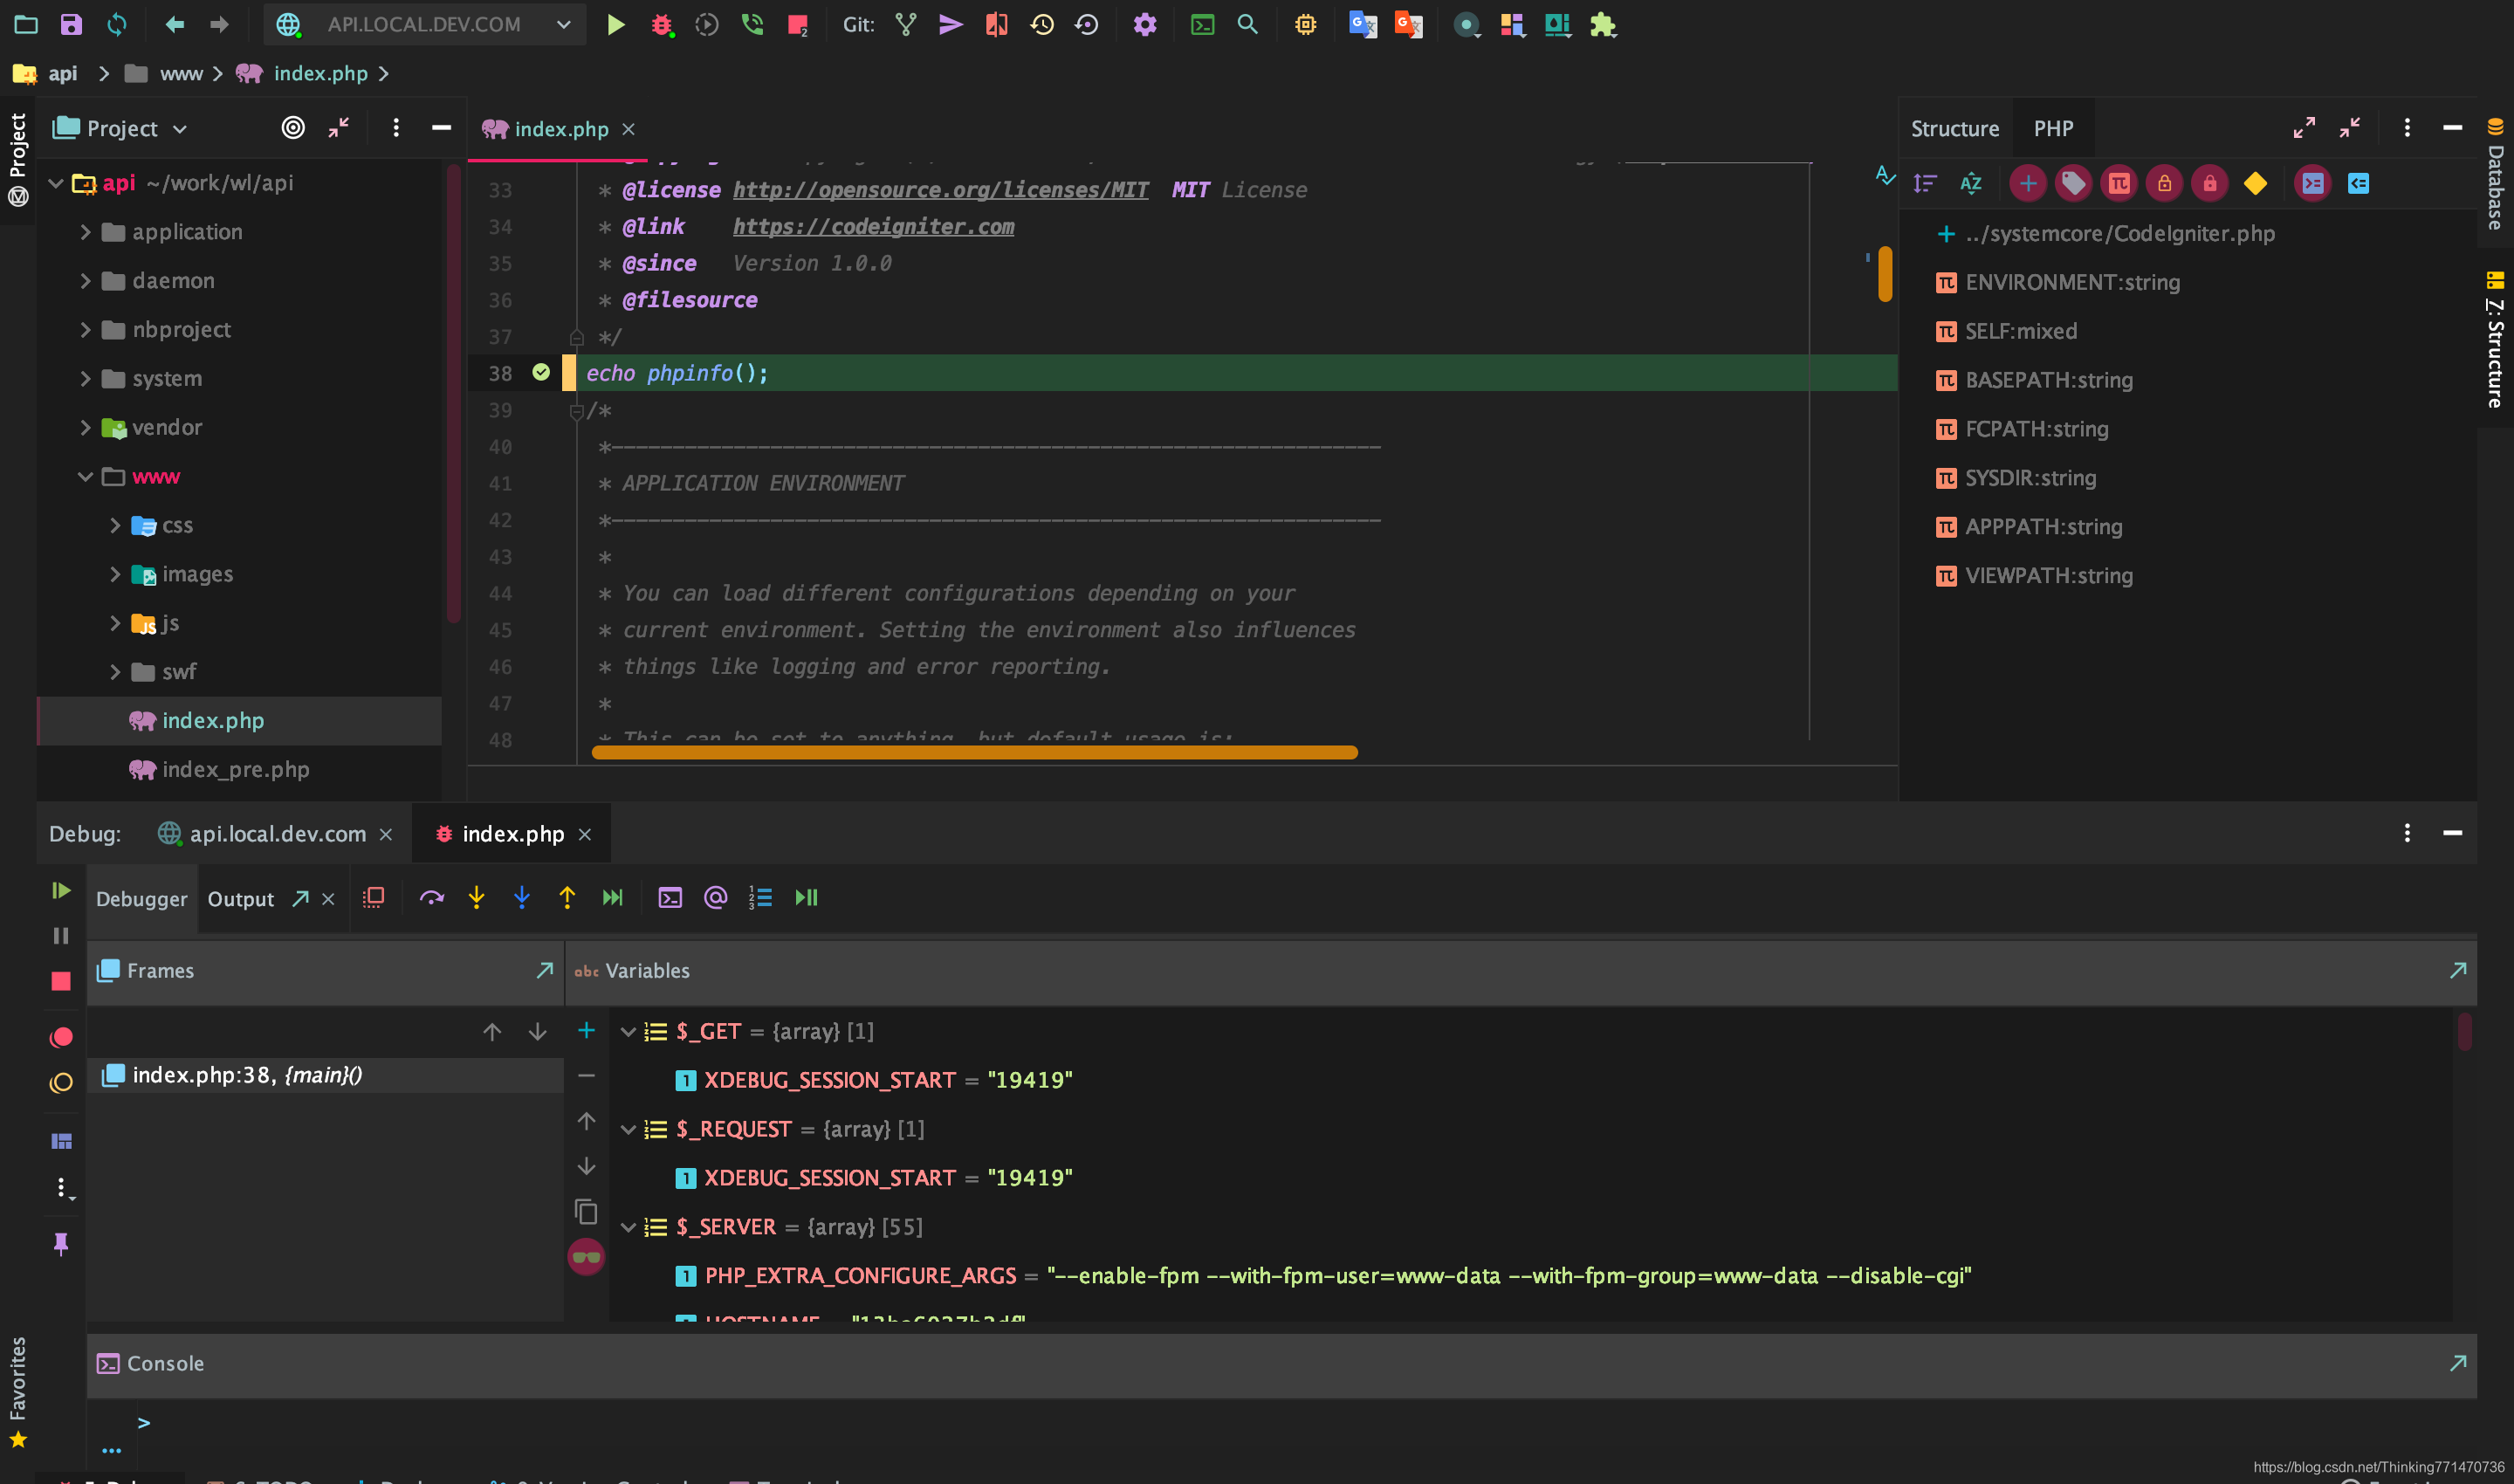
现在可以愉快地玩耍了:


 1598
1598

 被折叠的 条评论
为什么被折叠?
被折叠的 条评论
为什么被折叠?
 到【灌水乐园】发言


