


 本文介绍了Zabbix的基础表结构,并展示了如何利用Zabbix进行服务器CPU、内存使用率统计,磁盘目录使用率统计以及问题故障的统计分析。通过SQL查询,可以有效地监控服务器资源使用情况,优化资源分配,及时发现并处理问题。
目录
1.基础表结构介绍
在进行信息统计之前我们需要先了解一下几个基础表,关于全面详细表结构网上资料很多这里不作具体讲解,重点展示几个常见且实用的信息获取
| 表名 | 备注 | 表关键信息 |
| hosts | 主机 | 主机ip,备注 |
| hosts_groups | 主机组 | 主要起到服务器按组过滤 |
| items | 监控项 | 各个具体的监控项如:cpu,内存,磁盘 |
| trends | 趋势表 | 各个数值监控项,某一时间段内的数值 |
| trends_uint | 趋势表 | 各个数值监控项,某一时间段内的数值 |
2关键应用
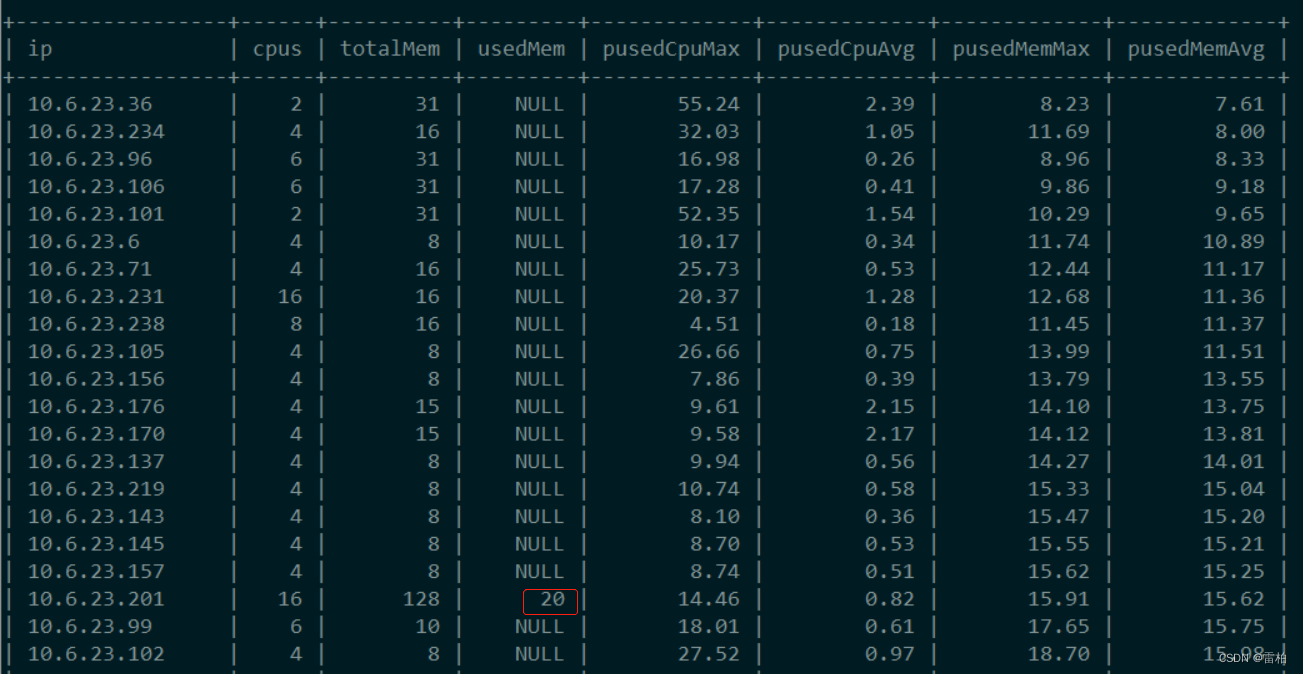
2.1 服务器cpu,内存使用率统计
对资源使用率低的服务器进行资源回收,负荷高的服务器进行升级,合理的分配资源
select ip,
max(case when item='Number of CPUs' or item='Number of cores'  then value_max  end) cpus,
max(case when item='Total memory'  then  round(value_max/1024/1024/1024,0)  end)totalMem,
max(case when item='Used memory'  then round(value_max/1024/1024/1024,0)  end)usedMem,
max(case when item='CPU utilization'  then round(value_max,2)  end)pusedCpuMax,
max(case when item='CPU utilization'  then round(value_avg,2)  end)pusedCpuAvg,
max(case when item='Memory utilization'  then round(value_max,2)  end)pusedMemMax,
max(case when item='Memory utilization'  then round(value_avg,2)  end)pusedMemAvg
from (
        select a.name ip ,b.name item,max(c.value_max)  value_max,avg(c.value_avg)value_avg
        from hosts a
        join items b on a.hostid=b.hostid
        join trends c on b.itemid=c.itemid
        where c.clock>UNIX_TIMESTAMP(date_sub(curdate(),interval 90 day))
        and b.name in ('Number of cores','Total memory','Memory utilization','Number of CPUs','Memory utilization','Used memory','CPU utilization')
        group by a.name,b.name

        union
        select a.name,b.name,max(c.value_max) value_max,avg(c.value_avg)value_avg
        from hosts a
        join items b on a.hostid=b.hostid
        join trends_uint c on b.itemid=c.itemid
        where c.clock>UNIX_TIMESTAMP(date_sub(curdate(),interval 90 day))
        and b.name in ('Number of cores','Total memory','Memory utilization','Number of CPUs','Memory utilization','Used memory')
        group by a.name,b.name
)t join hosts d on t.ip=d.name
where d.error not like '%cannot connect%' and d.status=0 and not exists (select 1 from hosts_groups e where e.groupid=17 and e.hostid=d.hostid )
group by ip
order by  pusedMemAvg;
效果图
usedMem非空的为Windows服务器,因为Linux服务器没有这个监控项
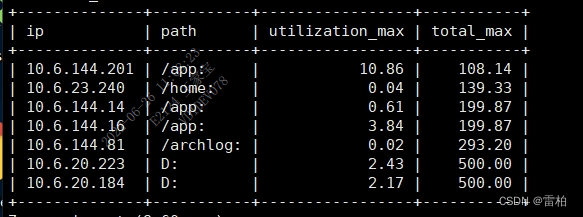
2.2磁盘目录使用率统计
使用率高的磁盘系统会告警,但是使用率低的不会有任何提示,因此我们可以通过此方法统计出空间利用率低的磁盘进行回收,避免资源浪费:以下统计的是某服务器组,磁盘总量大于100G且利用率低于20%的磁盘。
select ta.ip,substr(ta.item,1,locate(':',ta.item)) path,ta.utilization_max,tb.total_max
from
(select a.name ip ,b.name item,round(max(c.value_max),2) utilization_max
from hosts a
join items b on a.hostid=b.hostid
join trends c on b.itemid=c.itemid
where c.clock>UNIX_TIMESTAMP(date_sub(now(),interval 2 hour))
and length(b.name)<50 and b.name like '%Space utilization'
group by a.name,b.name
) as ta
 join

(select a.name ip ,b.name item,round(max(c.value_max)/1024/1024/1024,2) total_max
from hosts a
join items b on a.hostid=b.hostid
join trends_uint c on b.itemid=c.itemid
where c.clock>UNIX_TIMESTAMP(date_sub(now(),interval 2 hour))
and length(b.name)<50 and b.name like '%Total space'
group by a.name,b.name
)as tb
on ta.ip=tb.ip and substr(ta.item,1,locate(':',ta.item))=substr(tb.item,1,locate(':',tb.item))
join hosts d on ta.ip=d.name
where ta.utilization_max<20  and tb.total_max>100
and not exists (select * from hosts_groups e where e.groupid=17 and e.hostid=d.hostid )
order by tb.total_max asc;
效果图
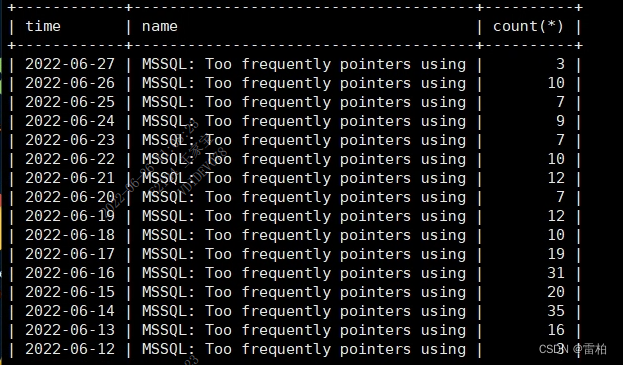
2.3问题故障统计
注意必须添加value条件过滤,因为一个事件有开始和关闭两个状态,如果不进行过滤会重复统计两次。
select date_format(from_unixtime(clock),'%Y-%m-%d')time,name,count(*)
from events
where name like '%frequent%' and value=0
group by date_format(from_unixtime(clock),'%Y-%m-%d'),name
order by date_format(from_unixtime(clock),'%Y-%m-%d') desc limit 30;
效果图


 328
328

 被折叠的 条评论
为什么被折叠?
被折叠的 条评论
为什么被折叠?
 到【灌水乐园】发言


