


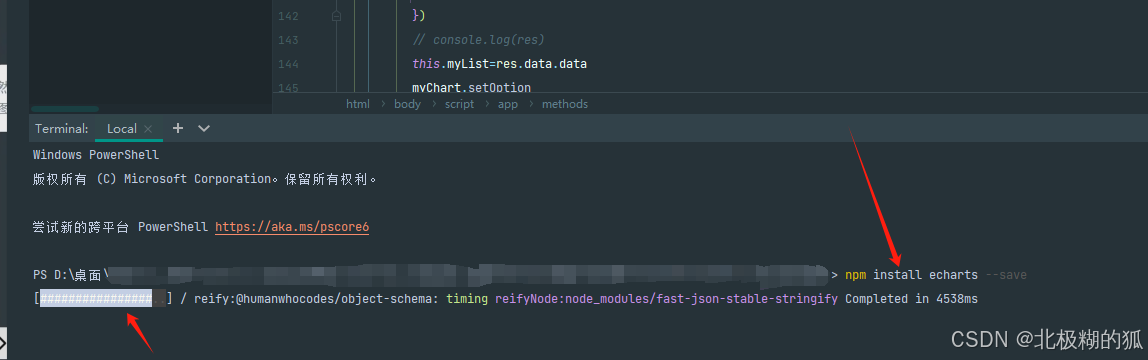
一、下载
npm install echarts --save下载界面:
二、项目中引入 Apache ECharts
在需要渲染图表的地方准备一个<div>
<body>
  <!-- 为 ECharts 准备一个定义了宽高的 DOM -->
  <div id="main" style="width: 600px;height:400px;"></div>
</body>基于准备好的dom,再初始化echarts实例,需要写在monted钩子里面实现,所以这里需要在created里面发请求获取数据,然后在mounted里面操作dom,所以需要写mounted钩子,在里面创建echarts进行使用了:
mounted() {
let myEchert = echarts.init(document.querySelector('#main'))
myEchert.setOption(
{
title: {
text: 'ECharts 入门示例'
},
tooltip: {},
legend: {
data: ['销量']
},
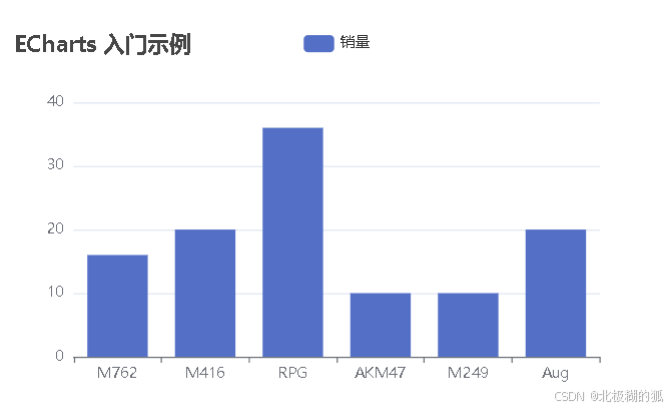
xAxis: {
data: ['M762', 'M416', 'RPG', 'AKM47', 'M249', 'Aug']
},
yAxis: {},
series: [
{
name: '销量',
type: 'bar',
data: [16, 20, 36, 10, 10, 20]
}
]
}
)
},效果如下
而其他统计图可以到官网找所有示例: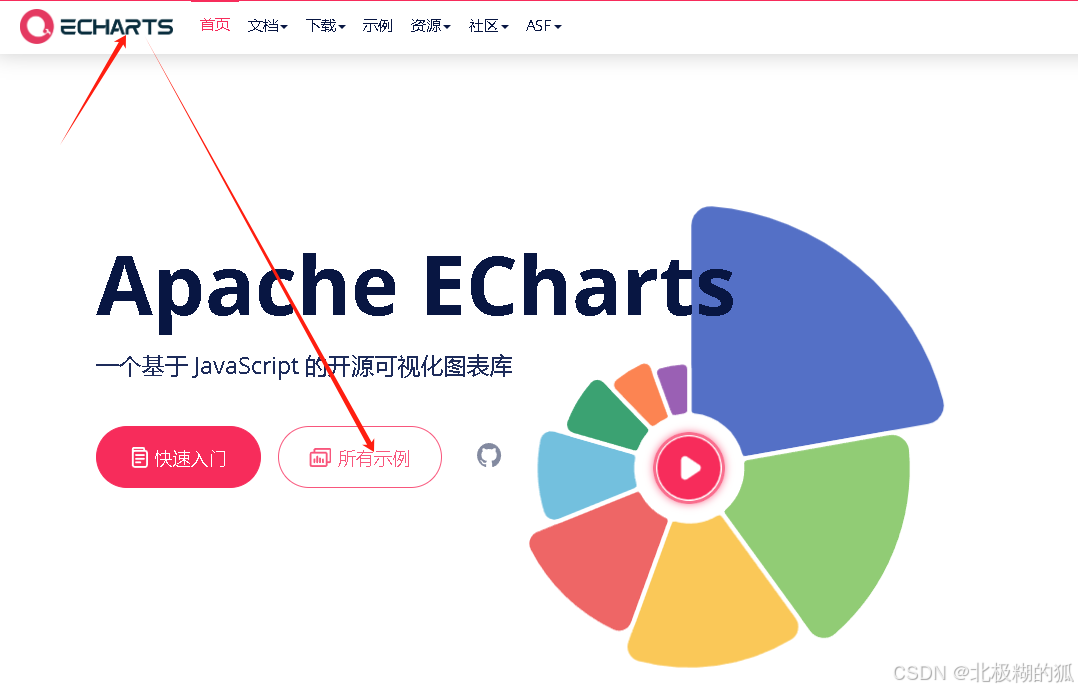
如饼图就是这里用最基础的饼图做示例: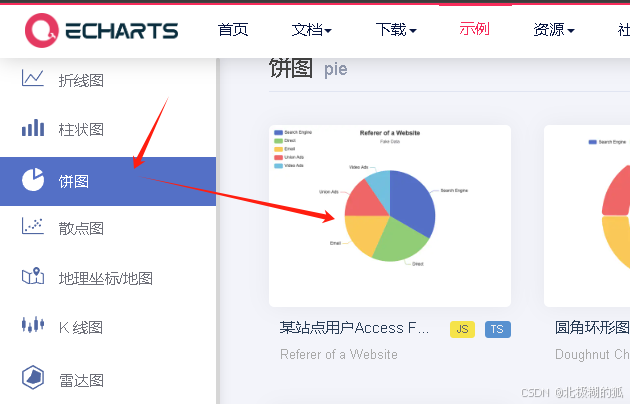
复制这一堆过去,塞到项目里面做参数对象,修改数值测试效果如下:
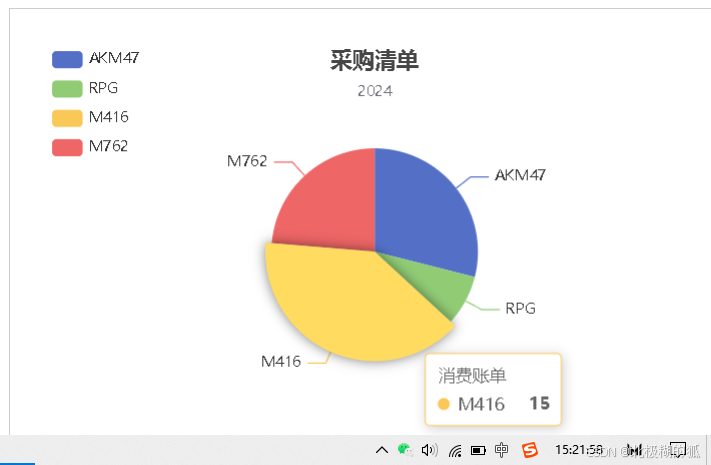
三、创建饼图实例
mounted() {
      //创建饼图实例
      let myEchert = echarts.init(document.querySelector('#main'))
      myEchert.setOption({
            title: {//标题
              text: '采购清单',//主标题
              subtext: '2024',//小标题
              left: 'center'
            },

            tooltip: { //提示框
              trigger: 'item'
            },
            legend: { //左上角图例
              orient: 'vertical',//对齐方式:垂直
              left: 'left'
            },
            series: [//单项悬浮标题
              {
                name: '消费账单',
                type: 'pie',//统计图类型:饼图
                radius: '50%',//半径
                data: [//这里data一般不会写死,要获取得到,其中value是值,name是名称
                  {value: 11, name: 'AKM47'},
                  {value: 3, name: 'RPG'},
                  {value: 15, name: 'M416'},
                  {value: 9, name: 'M762'}
                ],
                emphasis: {
                  itemStyle: {
                    shadowBlur: 10,
                    shadowOffsetX: 0,
                    shadowColor: 'rgba(0, 0, 0, 0.5)'
                  }
                }
              }
            ]
          }
      )
    },
而一般在工作中是发送请求获取数据,所以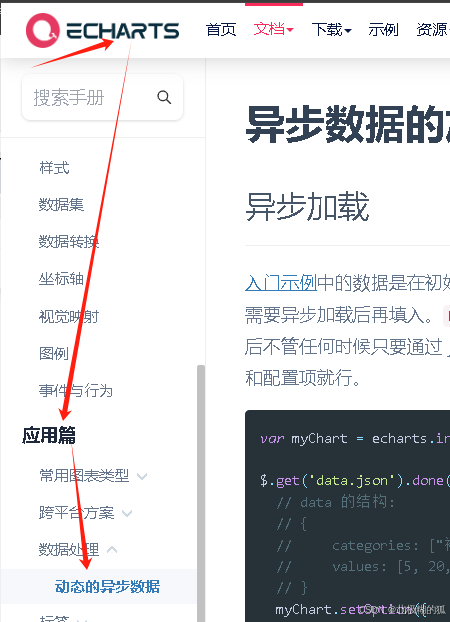
上面的中的数据是在初始化后setOption中直接填入的,但是很多时候可能数据需要异步加载后再填入。ECharts 中实现异步数据的更新非常简单,在图表初始化后不管任何时候只要通过 jQuery或Ajxs 等工具异步获取数据后通过 setOption 填入数据和配置项就行。
四、给实例初始化设置配置参数
可以在代码中,getList获取到data数据后,来写方法调setOption(),把需要更新的统计图配置量写到这个里面即可,
这里可以用this.来写myChart,就可以不用在data里面声明,即this.myChart=
mounted() {
      this.myChart = echarts.init(document.querySelector('#main'))
      this.myChart.setOption({
            title: {//标题
              text: '采购清单',//主标题
              subtext: '2024',//小标题
              left: 'center'
            },
            tooltip: { //提示框
              trigger: 'item'
            },
            legend: { //左上角图例
              orient: 'vertical',//对齐方式:垂直
              left: 'left'
            },
            series: [//单项悬浮标题
              {
                name: '消费账单',
                type: 'pie',//统计图类型:饼图
                radius: '50%',//半径
                data: [//这里data一般不会写死,要获取得到,默认写空即可,其中value是值,name是名称
                  {value: 11, name: 'AA'},
                  {value: 3, name: 'RPG'},
                  {value: 15, name: 'BB'},
                  {value: 9, name: 'M762'}
                ],
                emphasis: {
                  itemStyle: {
                    shadowBlur: 10,
                    shadowOffsetX: 0,
                    shadowColor: 'rgba(0, 0, 0, 0.5)'
                  }
                }
              }
            ]
          }
      )
    },
五、将发请求获取到的数据赋给统计图实例
所以现在可以先在methods方法里面的getList后面用this.myChart.setOption({})方法,把需要设置的配置项数据填入,所有传过的都不需要再传,只需要留data数据赋值,注意层级结构即可
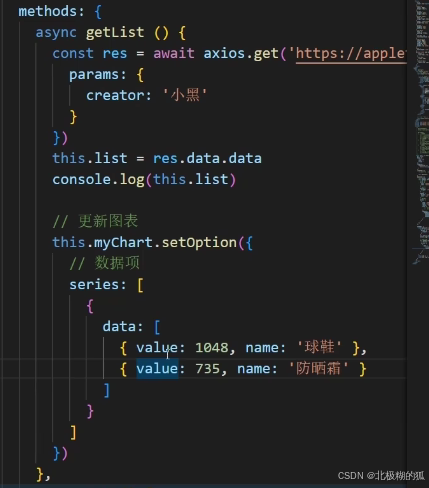
这里统计图需要的是name和value两个值,而业务data返回的是id、name、price、等,所以在getList取到data的值之后,就可以用map方法:将数组里面的每一个数组都进行转换处理赋值给统计图的data
data:this.list.map(item=>({value:item.price ,}))上面把用this.myChert=echarts.init()方法调获取数据存到统计图对象中,
详细代码:
<!DOCTYPE html>
<html lang="en">
<head>
  <meta charset="UTF-8"/>
  <meta name="viewport" content="width=device-width, initial-scale=1.0"/>
  <title>Document</title>
  <!-- CSS only -->
  <link
      rel="stylesheet"
      href="https://cdn.jsdelivr.net/npm/bootstrap@5.1.3/dist/css/bootstrap.min.css"
  />
  <style>
    .red {
      color: red !important;
    }

    .search {
      width: 300px;
      margin: 20px 0;
    }

    .my-form {
      display: flex;
      margin: 20px 0;
    }

    .my-form input {
      flex: 1;
      margin-right: 20px;
    }

    .table > :not(:first-child) {
      border-top: none;
    }

    .contain {
      display: flex;
      padding: 10px;
    }

    .list-box {
      flex: 1;
      padding: 0 30px;
    }

    .list-box a {
      text-decoration: none;
    }

    .echarts-box {
      width: 600px;
      height: 400px;
      padding: 30px;
      margin: 0 auto;
      border: 1px solid #ccc;
    }

    tfoot {
      font-weight: bold;
    }

    @media screen and (max-width: 1000px) {
      .contain {
        flex-wrap: wrap;
      }

      .list-box {
        width: 100%;
      }

      .echarts-box {
        margin-top: 30px;
      }
    }
  </style>
</head>
<body>
<div id="app">
  <div class="contain">
    <!-- 左侧列表 -->
    <div class="list-box">

      <!-- 添加资产 -->
      <form class="my-form">
        <input type="text" v-model.trim="name" class="form-control" placeholder="消费名称"/>
        <input type="text" v-model.number="price" class="form-control" placeholder="消费价格"/>
        <button type="button" @click="add" class="btn btn-primary">添加账单</button>
      </form>

      <table class="table table-hover">
        <thead>
        <tr>
          <th>编号</th>
          <th>消费名称</th>
          <th>消费价格</th>
          <th>操作</th>
        </tr>
        </thead>
        <tbody>
              <tr v-for="(item,index) in myList" :key="item.id">
                <td>{{index+1}}</td>
                <td>{{item.name}}</td>
                <td :class="{red:item.price>=500}">{{item.price.toFixed(2)}}</td>
                <td><a href="javascript:;" @click="del(item.id)">删除</a></td>
              </tr>

            </tbody>
            <tfoot>
              <tr>
          <td colspan="4">消费总计: {{ totalPrice.toFixed(2) }}</td>
        </tr>
        </tfoot>
      </table>
    </div>

    <!-- 右侧图表 -->
    <div class="echarts-box" id="main"></div>
  </div>
</div>
<script src="https://cdn.jsdelivr.net/npm/echarts@5.4.0/dist/echarts.min.js"></script>
<script src="https://cdn.jsdelivr.net/npm/vue@2/dist/vue.js"></script>
<script src="https://cdn.jsdelivr.net/npm/axios/dist/axios.min.js"></script>
<!--        <script src="echarts.js"></script>-->
<script>
  /**
   * 接口文档地址:
   * https://www.apifox.cn/apidoc/shared-24459455-ebb1-4fdc-8df8-0aff8dc317a8/api-53371058
   *
   * 功能需求:
   * 1. 基本渲染
   * 2. 添加功能
   * 3. 删除功能
   * 4. 饼图渲染
   */
  const app = new Vue({
    el: '#app',
    data: {
      myList: [],
      name: '',
      price: ''
    },
    computed: {
      totalPrice() {
        return this.myList.reduce((sum, item) => sum + item.price, 0);
      }
    },
    async created() {
      this.getList()
    },
    mounted() {
      this.myChart = echarts.init(document.querySelector('#main'))
      this.myChart.setOption({
            title: {//标题
              text: '采购清单',//主标题
              subtext: '2024',//小标题
              left: 'center'
            },

            tooltip: { //提示框
              trigger: 'item'
            },
            legend: { //左上角图例
              orient: 'vertical',//对齐方式:垂直
              left: 'left'
            },
            series: [//单项悬浮标题
              {
                name: '消费账单',
                type: 'pie',//统计图类型:饼图
                radius: '50%',//半径
                data: [//这里data一般不会写死,要获取得到,默认写空即可,其中value是值,name是名称
                  {value: 11, name: 'AA'},
                  {value: 3, name: 'RPG'},
                  {value: 15, name: 'BB'},
                  {value: 9, name: 'M762'}
                ],
                emphasis: {
                  itemStyle: {
                    shadowBlur: 10,
                    shadowOffsetX: 0,
                    shadowColor: 'rgba(0, 0, 0, 0.5)'
                  }
                }
              }
            ]
          }
      )
    },
    methods: {
      clean() {
        this.name = ''
        this.price = ''
      },
      async getList() {
        const res = await axios.get('https://applet-base-api-t.itheima.net/bill', {
          params: {
            creator: 'fly1'
          },
        })// console.log(res)
        this.myList = res.data.data
        this.myChart.setOption({
          series: [{
            data: this.myList.map(item => ({name: item.name, value: item.price}))
          }]
        })

      },

      async add() {
        if (!this.name) {
          alert("name不能为空")
          return
        }
        if (typeof this.price !== 'number') {
          alert('金额需为数字类型')
          return
        }
        const res = await axios.post('https://applet-base-api-t.itheima.net/bill', {
          creator: 'fly1',
          name: this.name,
          price: this.price
        })
        this.getList()
        this.clean()

      },

      del(id) {
        // console.log(id)  下面的id要用传过来的id,不写死所以用 ` 然后用$接上id
        const res = axios.delete(`https://applet-base-api-t.itheima.net/bill/${id}`)
        // console.log(res)
        this.getList()
      }
    }
  })
</script>
</body>
</html>

<!--       * https://www.apifox.cn/apidoc/shared-24459455-ebb1-4fdc-8df8-0aff8dc317a8/api-53371058-->


 911
911

 被折叠的 条评论
为什么被折叠?
被折叠的 条评论
为什么被折叠?
 到【灌水乐园】发言


