


 文章描述了一个项目需求,要求点击按钮后弹出对话框显示生命周期图。通过Vue组件和Echarts插件,实现数据驱动的动态图表,颜色根据状态变化。
需求
项目点击一个按钮后弹出框展示生命周期图
实现
利用Echarts插件
- 点击弹出框。生命周期页面在新的页面“lifeCycle.vue”编写,点击弹出框后引用此页面,引用代码如下:
<template>
 	<el-button type="text" icon="fa fa-circle-notch" @click="lifeCycleClick(val)" circle></el-button>
 	...
	<lifeCycle v-if="dialogLifeCycle" ref="lifeCycle"></lifeCycle>
	...
</template>
<script>
import lifeCycle from './LifeCycle'
export default {
	...
	components: {lifeCycle},
	data:function(){
		...
	},
	methods:{
	lifeCycleClick(val){
        this.dialogLifeCycle=true;
         this.$nextTick(() => {
             this.$refs.lifeCycle.init1(val);
         });
     },
   }
	...
}
</script>
- 生命周期页面lifeCycle.vue
代码如下,借用vue中使用echarts画一个生命周期图
<template>
    <el-dialog
        :title="title"
        :visible.sync="dialogVisible"
        width="50%" custom-class='dialog'>
        <div ref="box"  class="box"></div>
    </el-dialog>
</template>
<script>
import * as echarts from 'echarts'
method代码
init1(val) {
var Vuethis=this;
this.dialogVisible=true,
this.$nextTick(() => {
Vuethis.initEcharts(this.data);
})
},
initEcharts(data){
var myChart = echarts.init(this.$refs.box)
myChart.clear();
myChart.setOption({
title: {
text: '产品生命周期',
},
animationDurationUpdate: 1500,
animationEasingUpdate: 'quinticInOut',
legend: [
{
height: 10,
left: 'center',
itemGap: 15,
textStyle: {
color: (params) => params,
fontSize: 13,
},
},
],
color: ['#fc853e', '#28cad8', '#9564bf', '#bd407e', '#28cad8', '#e5a214'],
series: [
{
type: 'graph',
layout: 'none',
symbolSize: 50,
roam: false, // false禁止放大缩小拖拽
label: {
show: true,
},
edgeSymbolSize: [0, 10],
edgeLabel: {
fontSize: 20,
},
data: [
{
// name: '1 \n 已报备',
name: '1', // 球内的文字
x: 275, // 球X轴的位置
y: 0, // // 球Y轴的位置
itemStyle: {
normal: {
borderColor: '#3E8EF7', // 球内的边框颜色
borderWidth: 15, // 球的大小
color: '#3E8EF7', // 球的颜色
},
},
label: {
fontSize: 12, // 球内文字大小
color: '#fff', // 球内文字颜色
},
},
{
// name: '2',
name: '2',
x: 288,
y: 7,
// legend: {},
itemStyle: {
// 各圆圈自定义样式
normal: {
borderColor: this.active >= 2 ? '#3E8EF7' : '#ccc', // 判断,当active大于或者等于2时,球内的边框颜色为#3E8EF7,否则颜色为#ccc
borderWidth: 15,
// shadowBlur: 20,
shadowColor: '#ccc',
color: this.active >= 2 ? '#3E8EF7' : '#ccc', // 判断,当active大于或者等于2时,球的颜色为#3E8EF7,否则颜色为#ccc
// color: this.active == '验证中' ? '#3E8EF7':'#ccc',
// color: this.active == '验证失败' ? '#3E8EF7':'#ccc',
},
},
label: {
fontSize: 12,
fontWeight: 600,
color: '#fff',
// formatter:function(params){
// console.log(params,'params')
// return `<div>111</div>`+params;
// }
},
},
{
// name: '3',
name:'3',
// x: 0,
// y: 200,
x:288,
y:20,
itemStyle: {
// 各圆圈自定义样式
normal: {
borderColor: this.active >= 3 ? '#3E8EF7' : '#ccc',
borderWidth: 15,
// shadowBlur: 20,
shadowColor: this.active >= 3 ? '#3E8EF7' : '#ccc',
// color: new echarts.graphic.RadialGradient(0.5, 0.5, 1.0),
color: this.active >= 3 ? '#3E8EF7' : '#ccc',
},
},
label: {
fontSize: 12,
fontWeight: 600,
color: '#fff',
},
},
{
// name: '4',
name:'4',
x: 275,
y: 28,
itemStyle: {
// 各圆圈自定义样式
normal: {
borderColor: this.active >= 4 ? '#3E8EF7' : '#ccc',
borderWidth: 15,
// shadowBlur: 20,
shadowColor: this.active >= 4 ? '#3E8EF7' : '#ccc',
// color: new echarts.graphic.RadialGradient(0.5, 0.5, 1.0),
color: this.active >= 4 ? '#3E8EF7' : '#ccc',
},
},
label: {
fontSize: 12,
fontWeight: 600,
color: '#fff',
},
},
{
// name: '5',
name:'5',
x: 262,
y: 20,
itemStyle: {
// 各圆圈自定义样式
normal: {
borderColor: this.active >= 5 ? '#3E8EF7' : '#ccc',
borderWidth: 15,
// shadowBlur: 20,
shadowColor: this.active >= 5 ? '#3E8EF7' : '#ccc',
color: this.active >= 5 ? '#3E8EF7' : '#ccc',
},
},
label: {
fontSize: 12,
fontWeight: 600,
color: '#fff',
},
},
{
// name: '6',
name:'6',
x: 262,
y: 7,
itemStyle: {
// 各圆圈自定义样式
normal: {
borderColor: this.active >= 6 ? '#3E8EF7' : '#ccc',
borderWidth: 15,
// shadowBlur: 20,
shadowColor: this.active >= 6 ? '#3E8EF7' : '#ccc',
color: this.active >= 6 ? '#3E8EF7' : '#ccc',
},
},
label: {
fontSize: 12,
fontWeight: 600,
color: '#fff',
},
},
],
// links: [],
links: [ // links自定义线
// 1-2 1到2的位置的线
{
source: 0,
target: 1,
symbolSize: [20, 20], // 线的大小
symbol: ['', 'arrow'], // 线加箭头,两个为arrow,则是双箭头
label: {
// show: true
},
lineStyle: {
// 线的颜色,判断active为2时,线的颜色为#3E8EF7,否则为#ccc
color: this.active >= 2 ? '#3E8EF7' : '#ccc',
},
},
{
// 2-3 ,2到3的位置的线
source: 1,
target: 2,
symbolSize: [10, 20],
symbol: ['', 'arrow'],
lineStyle: {
color: this.active >= 3 ? '#3E8EF7' : '#ccc',
},
},
{
// source: 2,
// target: 0,
// symbolSize: [0, 10],
// symbol: ['', 'arrow'],
lineStyle: {
color: this.active >= 3 ? '#3E8EF7' : '#ccc',
},
},
{
source: 2,
target: 3,
symbolSize: [0, 20],
symbol: ['', 'arrow'],
lineStyle: {
color: this.active >= 4 ? '#3E8EF7' : '#ccc',
},
},
{
// source: 3,
// target: 0,
// symbolSize: [0, 10],
// symbol: ['', 'arrow'],
lineStyle: {
color: this.active >= 4 ? '#3E8EF7' : '#ccc',
},
},
{
source: 3,
target: 4,
symbolSize: [0, 20],
symbol: ['', 'arrow'],
lineStyle: {
color: this.active >= 5 ? '#3E8EF7' : '#ccc',
},
},
{
// source: 4,
// target: 0,
// symbolSize: [0, 10],
// symbol: ['', 'arrow'],
lineStyle: {
color: this.active >= 5 ? '#3E8EF7' : '#ccc',
},
},
{
// 5-6的线
source: 4,
target: 5,
symbolSize: [0, 20],
symbol: ['', 'arrow'],
lineStyle: {
// width:10,
curveness: 0.2,
color: this.active >= 6 ? '#3E8EF7' : '#ccc',
},
},
{
source: 5,
target: 0,
// symbol: ['', 'arrow'],
// symbolSize: [0, 10],
lineStyle: {
// width: 3,
// curveness: 0
// width:10,
curveness: 0.2,
color: this.active >= 6 ? '#3E8EF7' : '#ccc',
},
},
],
lineStyle: {
opacity: 0.8,
width: 10,
curveness: 0.2,
color: '#3E8EF7',
},
},
],
})
// 让echarts自适应
window.addEventListener("resize", function () {
myChart.resize();
});
}
其他代码暂不列出。
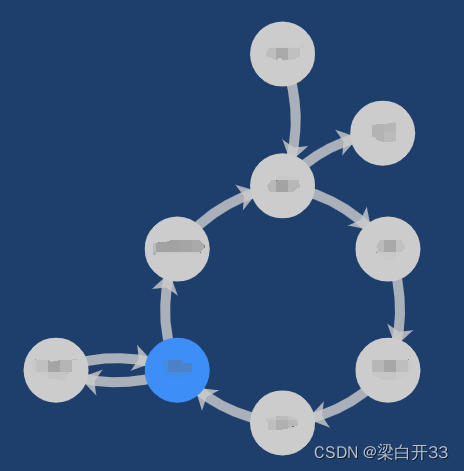
效果
这里的效果是项目中实现的效果,与所展示的代码不同,此效果代码暂不展示。


 5145
5145

 被折叠的 条评论
为什么被折叠?
被折叠的 条评论
为什么被折叠?
 到【灌水乐园】发言


