


 该文介绍了如何利用Mapbox进行数据可视化,通过加载气泡图片、GeoJSON数据以及创建Symbol图层,在地图上展示带有数据的气泡。示例中,数据以点要素的GeoJSON格式呈现,气泡的大小和颜色可表示不同数值。
前言
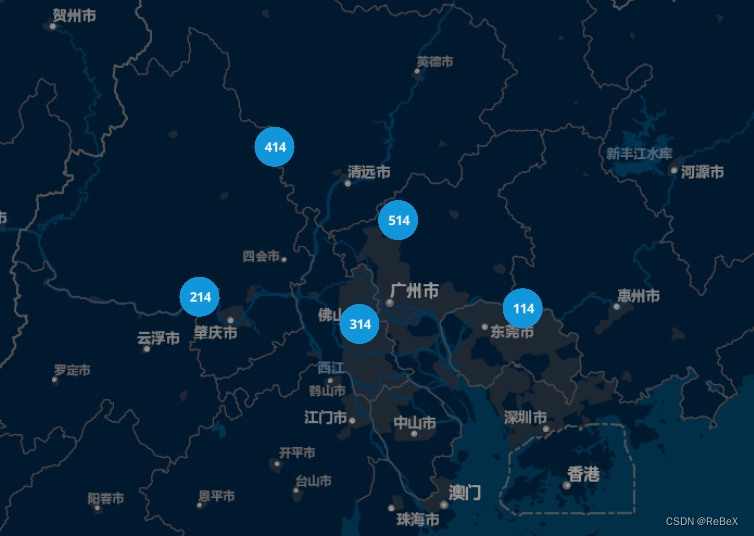
现在有这么一个数据可视化的需求,在地图上绘制带有数据的气泡。那么就用一个比较简单和快的方法来实现一下,实现步骤:①加载气泡图片 ②加载数据 ③创建Symbol图层。
实现
这次用的示例数据是GeoJSON格式的点要素,且properties中有自己打算展示的数据。
const testJson =
{
  "type": "FeatureCollection",
  "features": [
    {
      "type": "Feature",
      "properties": {
        "num": 414
      },
      "geometry": {
        "coordinates": [
          112.68784006428433,
          23.85455050268874
        ],
        "type": "Point"
      }
    }
  ]
}
第一步:向地图中加载气泡的图像
本次气泡图的气泡就用最简单的圆形:circle.png
 // 加载图标
 map.loadImage(require('@/assets/circle.png'), function (error, image) {
   if (error) throw error
   map.addImage('bubbleIcon', image)
 })
第二步:加载气泡图层
map.addSource('bubbleSource', {
  type: 'geojson',
  data: testJson // GeoJSON格式的数据
})

map.addLayer({
  id: 'bubbleLayer',
  type: 'symbol',
  source: 'bubbleSource',
  layout: {
    'icon-image': 'bubbleIcon', // 图标ID
    'icon-allow-overlap': true, // 允许图标重叠
    'text-allow-overlap': true, // 允许文字重叠
    'icon-size': 0.2, // 图标的大小
    'icon-anchor': 'center', // 图标的位置
    'text-field': ['get', 'num'], // 获取num属性的值
    'text-font': ['Open Sans Bold'], // 字体
    'text-size': 13,
    'text-anchor': 'center'
  },
  paint: {
    'text-color': '#fff'
  }
})
上面的代码中,'text-field': ['get', 'num'], 指的是从矢量数据的properties中获取num的值,另一种写法是:'text-field': '{num}',。
完整代码
import { map } from '@/utils/createMapbox' // 地图对象
import testJson from '@/assets/data/point.json' // 引入测试数据

export default class DrawBubble {
  constructor () {
    // 加载图标
    map.loadImage(require('@/assets/circle.png'), function (error, image) {
      if (error) throw error
      map.addImage('bubbleIcon', image)
    })
  }

  // 绘制气泡
  drawBubble () {
    map.addSource('bubbleSource', {
      type: 'geojson',
      data: testJson // GeoJSON格式的数据
    })
    map.addLayer({
      id: 'bubbleLayer',
      type: 'symbol',
      source: 'bubbleSource',
      layout: {
        'icon-image': 'bubbleIcon', // 图标ID
        'icon-allow-overlap': true, // 允许图标重叠
        'text-allow-overlap': true, // 允许文字重叠
        'icon-size': 0.2, // 图标的大小
        'icon-anchor': 'center', // 图标的位置
        'text-field': ['get', 'num'],
        // 'text-field': '{num}',
        'text-font': ['Open Sans Bold'],
        'text-size': 13,
        'text-anchor': 'center'
      },
      paint: {
        'text-color': '#fff'
      }
    })
  }

  // 清除该功能绘制的符号等等等等
  clear () {
    // 删除图层与数据源
    if (map.hasImage('bubbleIcon')) map.removeImage('bubbleIcon')
    try {
      map.removeLayer('bubbleLayer')
      map.removeSource('bubbleSource')
    } catch (error) {
      console.log(error)
    }
  }
}
拓展
绘制相同图形但不同颜色的气泡:【WebGIS实例】(7)MapboxGL绘制不同颜色的Symbol图标


 1660
1660

 被折叠的 条评论
为什么被折叠?
被折叠的 条评论
为什么被折叠?
 到【灌水乐园】发言


